Sunspots have been observed for thousands of years, even before the development of the solar telescope provided a way to safely view our dazzling local star. Systematic records of sunspot numbers and their positions didn’t begin, though, until the mid-1800s. Still, these records represent the longest running dataset of any cosmic phenomenon and reveal an intriguing side to the Sun’s character.
The number of sunspots observed on the surface of the Sun follows a roughly 11-year pattern of peaks and troughs known as the solar cycle.
While we still have a lot to learn to accurately estimate the patterns of future solar cycles, predictions over the past decade suggested that our current cycle would be smaller than average. And the numerous missions dedicated to the study of the Sun are only making our predictions more accurate.
Does this mean an overall waning of solar activity? New research over the coming years may help us get a better idea of what the future holds for our host star.
Perhaps you could get involved in capturing images of the Sun for scientific study. For more on this, read Pete Lawrence's fascinating guide on how to photograph the Sun.
A history of solar science
That the solar cycle was ever noticed is thanks to astronomers spurred on by the possibility of discovering a new planet.
In 1846 Neptune had been discovered in the search to understand whether irregularities in the orbit of Uranus were due to problems with Newton’s theory of gravity, or the gravitational effect of a then undiscovered planet.
The latter idea won. So when irregularities were discovered in Mercury’s orbit, it seemed only sensible to take the same approach and the existence of the planet Vulcan orbiting close to the Sun was proposed.
The theory could be tested observationally by looking for the planet as it transited the Sun.
One person who took up this challenge was German pharmacist-turned-astronomer Heinrich Schwabe, who observed the Sun every clear day from 1826 to 1843.
Although he found no evidence for the hypothetical planet Vulcan, his sunspot records did reveal a 10-year period or so during which their numbers rose.
A repetitive process seemed to be at work. Soon astronomers across Europe were being encouraged by the director of Bern Observatory – Rudolf Wolf – to make regular observations of the Sun and record their findings.
Wolf combined the new sunspot records with those taken in the centuries before and was able to reconstruct sunspot cycles back to 1755. He called this ‘cycle 1’ and numbered all the following cycles consecutively.
")
What causes sunspots?
Solar cycle studies focused for many years on data collection, such as sunspot number, location and shape, until the true origin of sunspots was shown by George Ellery Hale in 1908.
Hale discovered that these dark spots on the Sun are actually the intersection of colossal tubes of magnetism penetrating the photosphere.
This discovery started a revolution in solar physics and showed us that the solar cycle is actually a magnetic one.
Today we understand that flows of electrically charged gas inside the Sun both sustain and evolve the global magnetic field.
The solar cycle captures all the stages of this evolution. At the start of the cycle, the Sun’s global field is aligned in a north-south direction.
The flows then drag out this field so it becomes more aligned with the east-west direction.
When portions of the interior field grow too strong, they become buoyant and a loop rises to penetrate the Sun’s surface.
Sunspots form at the two foot points of the loop: one sunspot with a south magnetic pole next to a spot with a north pole. Just like the configuration of a magnet.
The fluid nature of the Sun means sunspots don’t live forever. The solar cycle progresses because flows at the surface of the Sun start to tear apart the magnetic fields of the sunspots, spreading the field over ever-larger areas.
As the field disperses, the sunspots disappear. Eventually, more fluid flows take the magnetic field up towards both poles of the Sun where it gets reprocessed, ready to feed into the next cycle.
Overall, the evolution of the Sun’s magnetic field that drives the solar cycle might seem straightforward.
But consider this: cycles can be large or small, and cycles of different sizes do not follow each other at random.Instead, a few large cycles will be followed by a few small cycles.
Analysing this trend has also revealed an 80-year so-called ‘Gleissberg cycle’ on top of the 11-year cycle.
And on top of this are the 200-year de Vries and the 2,300-year Hallstat cycles too. Developing a model that can explain all these details is an important area in modern solar physics.
How the solar cycle works
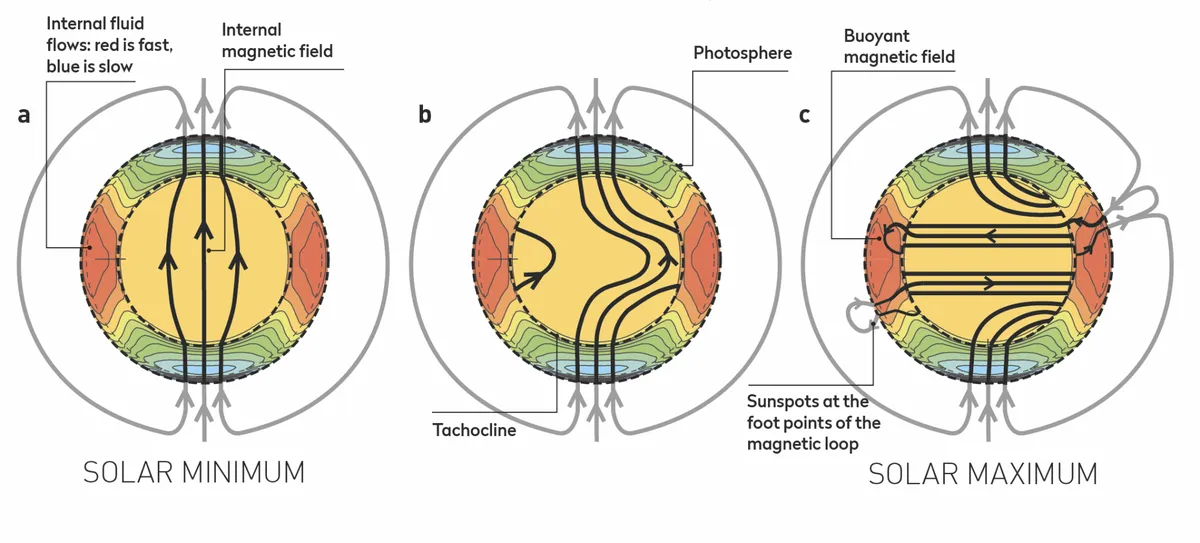
This diagram reveals the inner workings of the Sun during the solar cycle. The magnetic field evolves from being aligned north-south at solar minimum (a) to aligning east-west (b), and eventually being multipolar at solar maximum (c).
The photosphere is the visible layer of the Sun that we are familiar with, where sunspots are formed; the tachocline is a region inside the Sun where the magnetic field gets distorted and moved.
 can be further grouped into 80-100 year Gleissberg cycles (shown here as a yellow arc) as seen when we look back at the last 200 years of sunspot data. Credit: Paul Wootton")
The discovery of the Sun’s magnetism was also key to understanding the violent side of the Sun’s character: solar flares and coronal mass ejections (CMEs) driven by colossal releases of energy stored in the solar magnetic field.
The frequency of solar flares and CMEs peaks at the apex of each solar cycle, as does the amount of light that the Sun emits.
At cycle maximum, with the most sunspots, the Sun is fraction of a per cent brighter.
Certain rules are obeyed during a solar cycle. Sunspots appear at high latitudes at the start,
with the sunspots that form during subsequent years appearing at progressively lower latitudes.
This pattern is shown wonderfully clearly in the so-called ‘butterfly’ diagram published by astronomers Annie and Walter Maunder in 1904 (see below).

When pairs of sunspots appear, one with a north pole and one with a south, sunspots in each hemisphere will nearly always appear in the same order as the Sun rotates.
For cycle 24, pairs of sunspots in the northern hemisphere that came into view as the Sun rotated had the south pole spot appear slightly ahead of the north.In the southern hemisphere, it was the opposite way round.
This swaps every solar cycle, meaning you can use the magnetic field of sunspots to determine which cycle they formed in.
The rules apply to the overall global field of the Sun too, and at the peak of each cycle the polar magnetic fields swap their magnetic polarity.
All this prompted the American National Oceanic and Atmospheric Administration and NASA to form a ‘Solar Cycle 24 Prediction Panel’ to see what models and theories are best able to predict solar cycle size, duration and peak.
Prediction methods vary. One uses the finding that the number and frequency of sunspot formation at the start of a cycle is linked to the size and timing of that cycle’s peak.
Another assesses the strength of the polar magnetic field, that is the ‘seed’ from which each cycle grows. Another looks at the strength of the gas flows that ultimately drive the cycle.
Yet, another approach is to consider solar activity over timescales much longer than a single 11-year cycle.
The challenge is that it is easier to forecast once the sunspots of a new cycle have started to appear.
Then the rate at which the sunspots are forming can be compared with that of previous cycles to get an idea of how the new cycle will play out in terms of size and duration.
Initial predictions for cycle 24 came in 2006, even before the first sunspots of that cycle formed.
Solar minimum – when the number of sunspots is lowest – was forecast for March 2008 with a moderately large maximum in 2011.
In January 2008 the first sunspots of the cycle were seen and by 2009 there were enough to be used in cycle prediction methods.
A revised statement from the Solar Cycle Prediction Panel followed in May 2009, downgrading the forecast to a smaller than average cycle that would peak in May 2013.
Another slight downgrade came again in 2011. At this time the solar physics community was feeling pessimistic about the status of the Sun’s cycles, with some even suggesting that in the coming decades we might experience a strong downturn of the type seen in the Maunder Minimum, when the solar cycle appeared to switch off for several decades in the mid-1600s.
It felt like the Sun was fading in front of our eyes.
The Sun eventually reached solar maximum in April 2014 and although the predictions didn’t do too badly, it was clear we have a lot to learn.
It is never possible to say exactly when minimum occurs until we have passed that point. We need to see the sunspot number drop and then start to rise again with spots that have the new cycle’s magnetic field orientation.
What we can say, though, is that some very small and short-lived magnetic field bipoles have emerged at high latitudes with the correct, swapped, orientation for cycle 25.
However, they never grew into fully-fledged sunspots groups that were officially recognised.

How bright is the future?
What might cycle 25 have in store? Well, the challenges with predictions in previous years have motivated new research.
New physical models are being developed along with new analysis of the observations.
A forecast by a team from the Indian Institute of Science Education and Research in Kolkata has published their prediction for a cycle similar in size or slightly larger than the current one, with a peak in 2024.
If correct, it could mean that the previous opinions that the Sun’s activity is fading might be reversed.
With still so much to learn about processes that play out over the full surface of the Sun is it clear that we need more data.
But one of the limiting factors comes from our viewpoint. All our telescopes take images from close to the plane of the Sun’s equator, when many of the important processes take place near the poles.
The solution to this predicament is the European Space Agency’s Solar Orbiter mission. It will become the first spacecraft to take images of the Sun from a high-latitude vantage point.
We will be able to track the magnetic field that drives one cycle into the next, filling in the gaps in our knowledge.
From this new physical theories will be developed and, we hope, we will finally unlock the secrets of the solar cycle.
Prof Lucie Green is a Professor of Physics at Mullard Space Science Laboratory. This article originally appeared in the May 2019 issue of BBC Sky at Night Magazine.