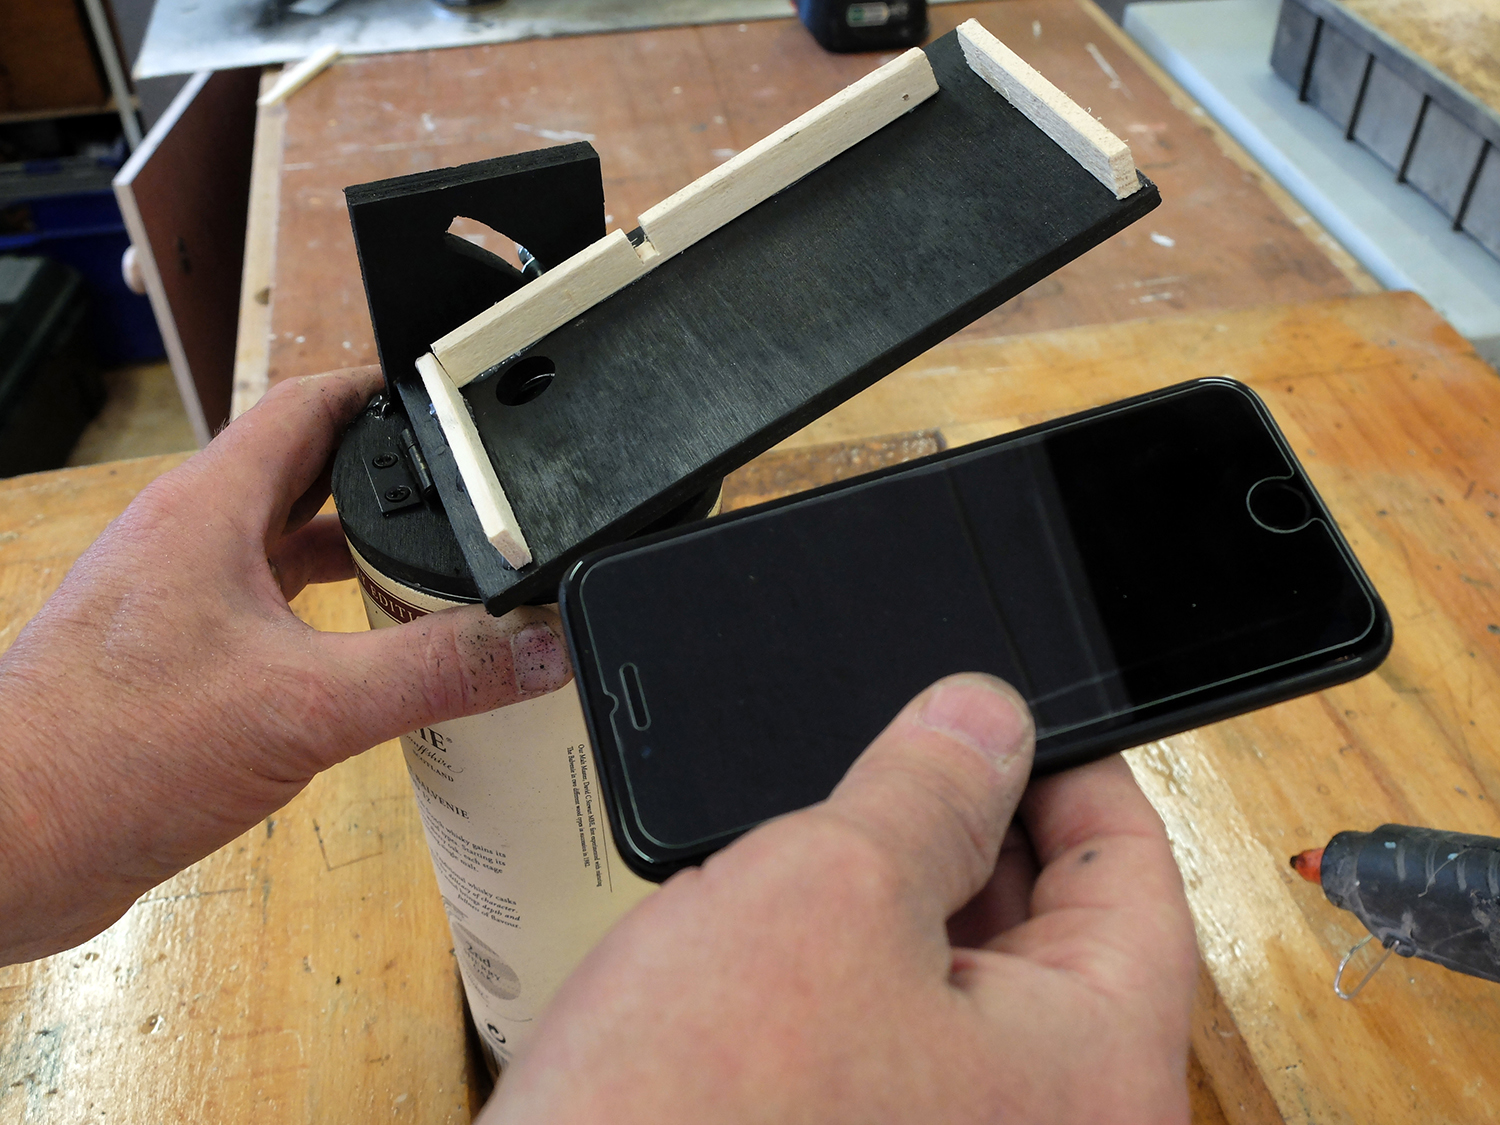
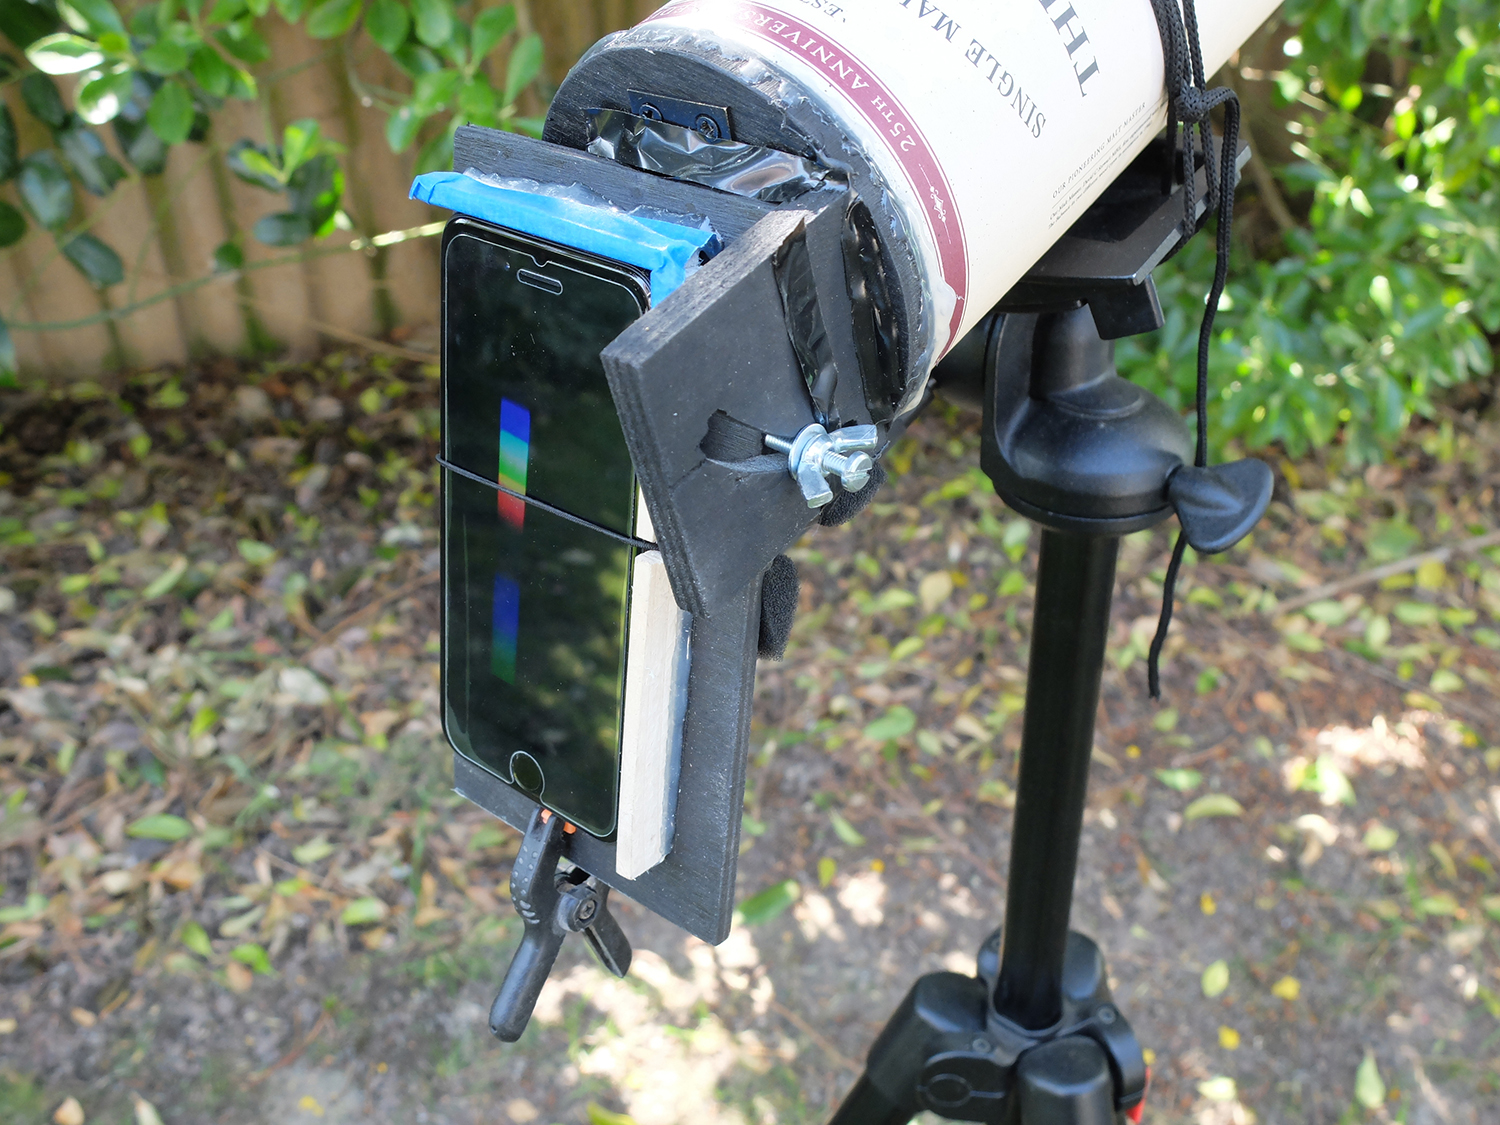
This is a classic project for demonstrating the nature of light: a spectrograph that can be used visually and with a smartphone or a hand-held camera. We have provided plans and extra photos to help (see below in Step 1), along with key dimensions, but because your phone and tube size may vary, you might need to adapt these to suit.
To use the spectrograph, simply point the front towards the bright object you are studying. When you look into the back you’ll see that the light from the source is spread out into a rainbow-like spectrum.
Bright coloured bands or dark gaps in an otherwise continuous spectrum can reveal a lot about the nature of the source. If you mount your smartphone or hold up a camera you can record any spectrum for more analysis.
This spectrograph has three key elements,:
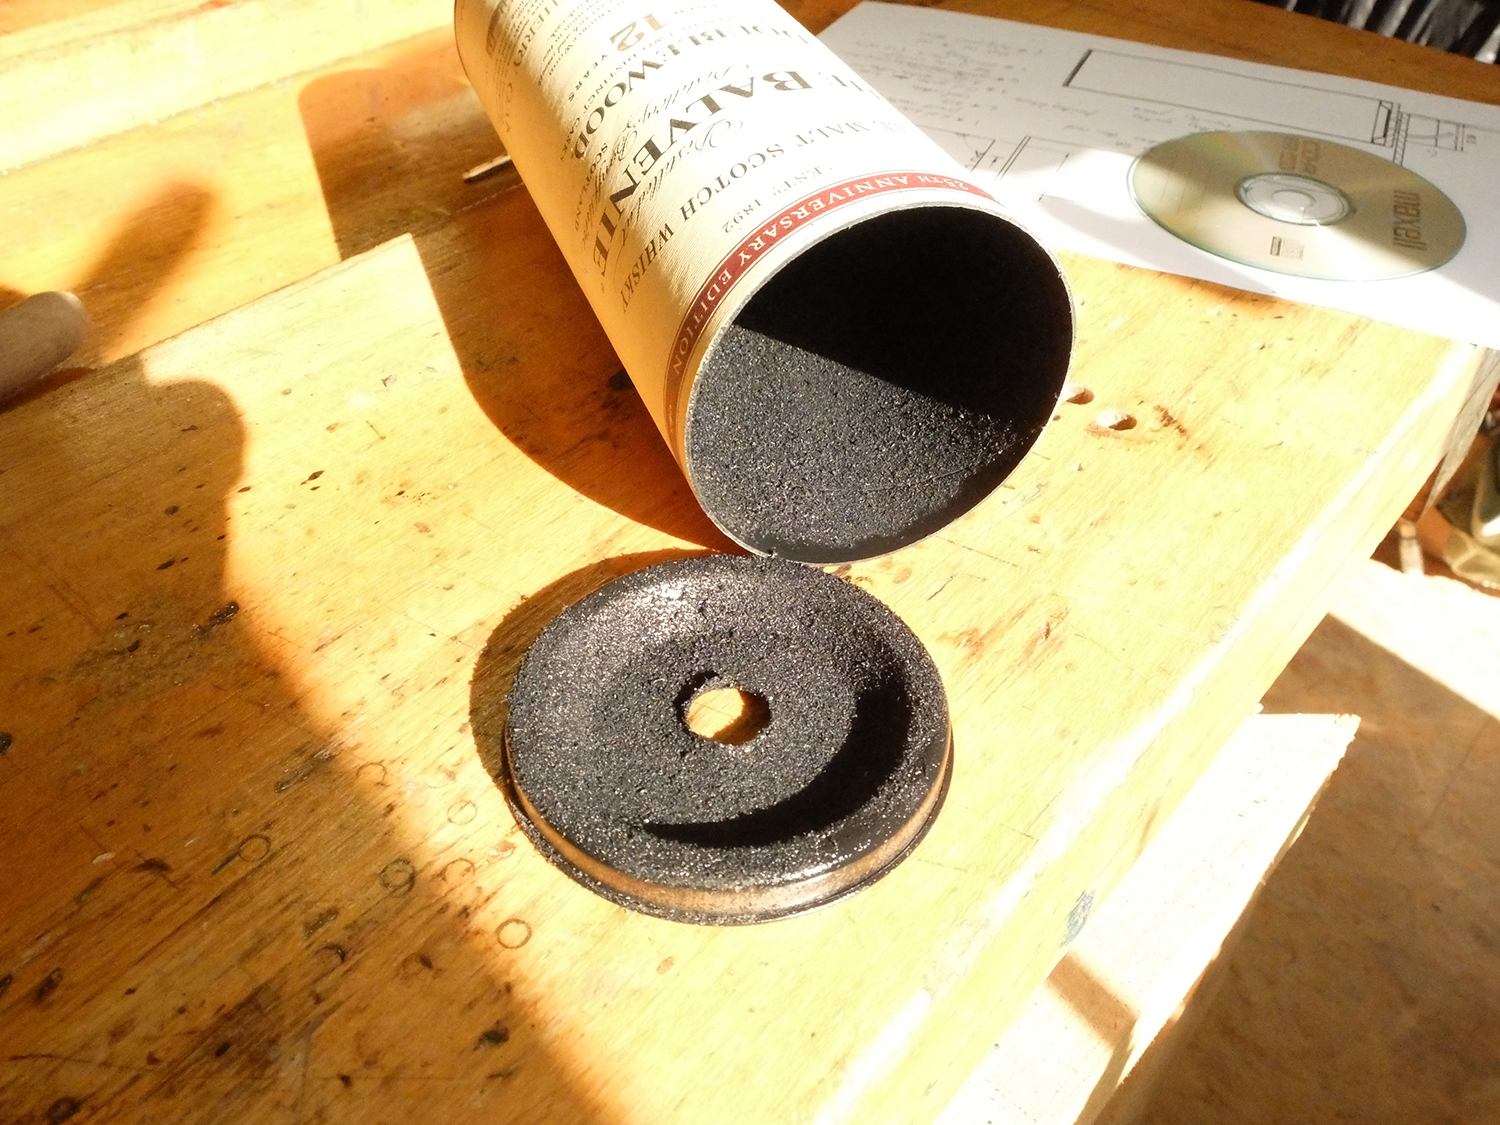
- A tube (stiff cardboard with a lid and a base)
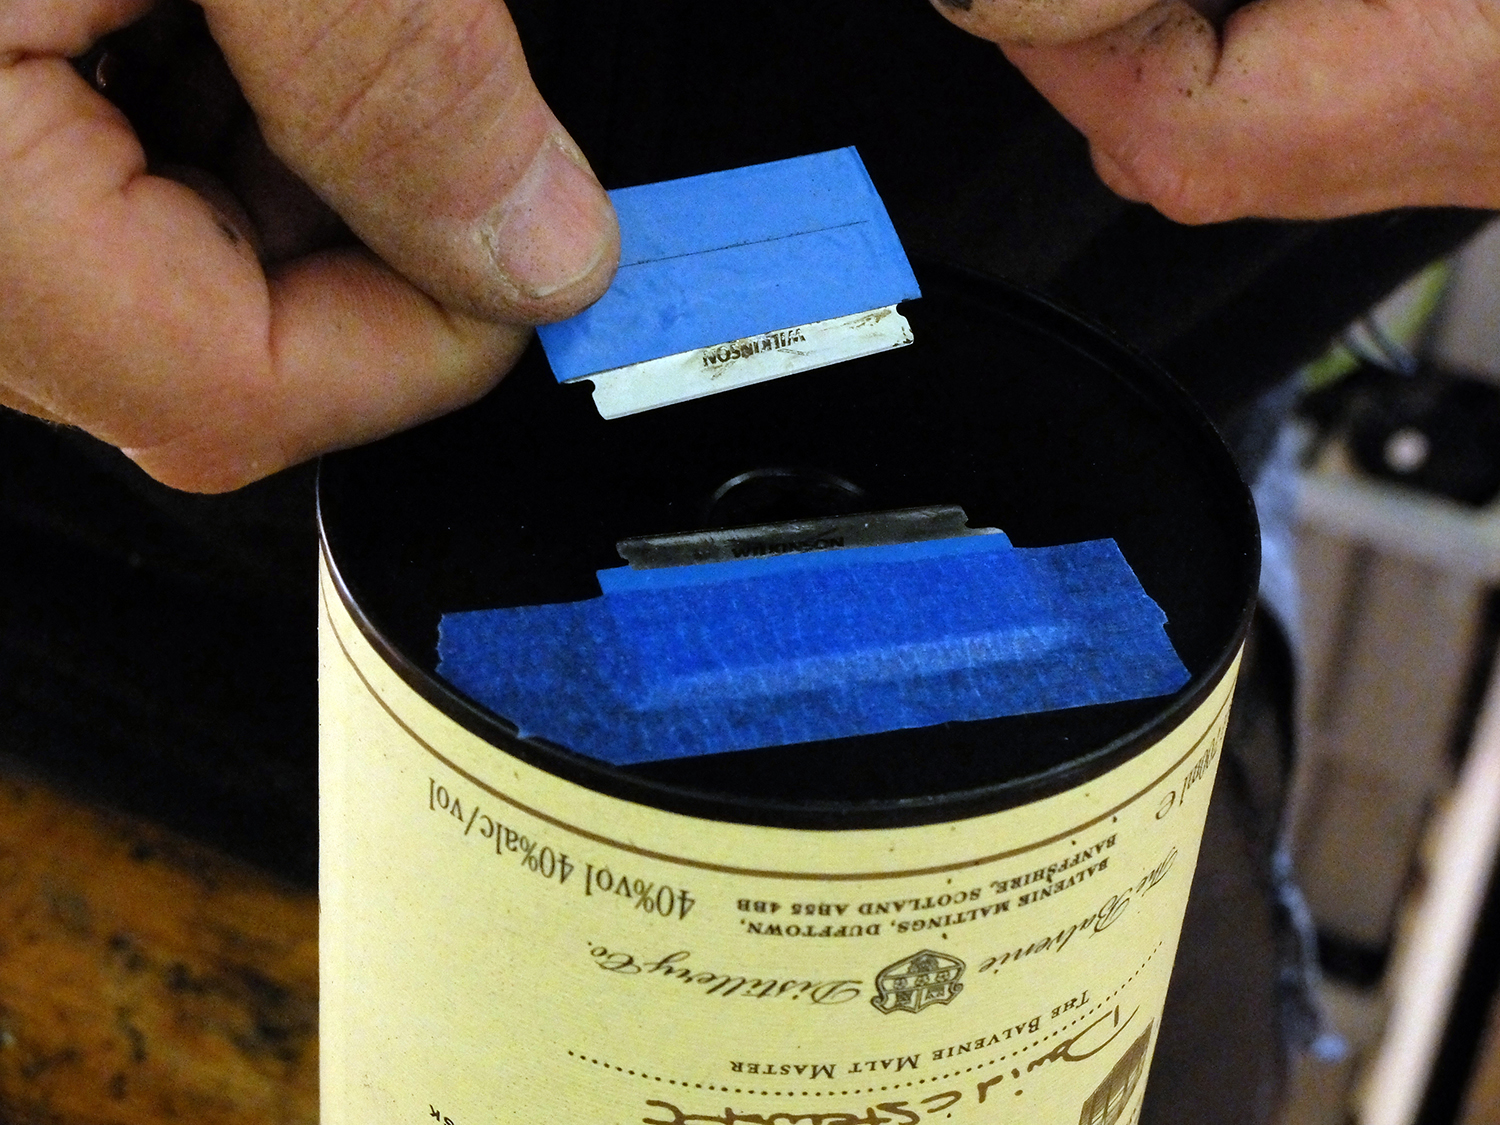
- A slit
- A grating
The slit is formed by two razor blades, taped across a hole in the base of the tube so that they are almost touching; remember to handle them carefully.
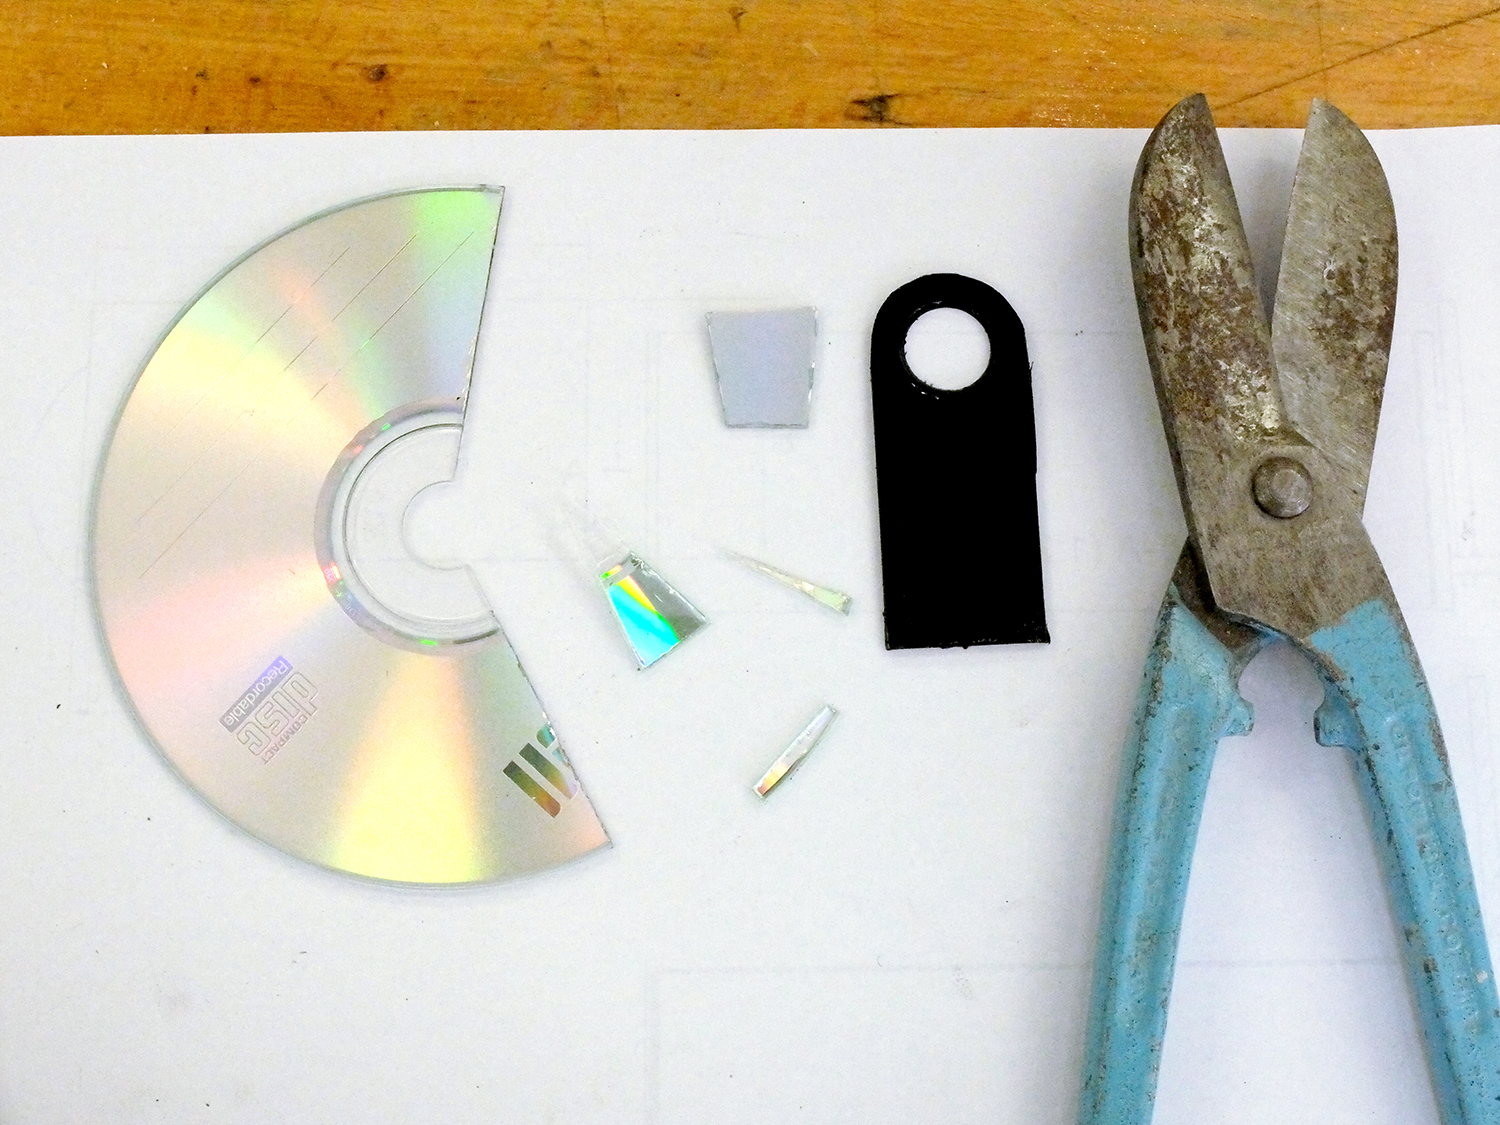
The grating is made from a small piece of a blank CDR (recordable compact disc), with its label removed, mounted across a similar hole in the lid of the tube.
This is cut from an area close to the circumference of the disc where its microscopic lines are almost straight.
Incoming light passes though the slit, forming a narrow beam. When this passes through the grating, it is divided, forming tiny copies of the beam.
The light from each of these interacts, like the ripples from many pebbles dropped into a pool; sometimes the waves add together so the light is visible, sometimes they subtract so it’s not.
The result is that the constituent wavelengths (colours) of the source light are observed at varying angles away from the original beam.
Find out more in our guide to the science of spectroscopy or our tutorial on how to get started in spectroscopy.
How to use your smartphone spectrograph
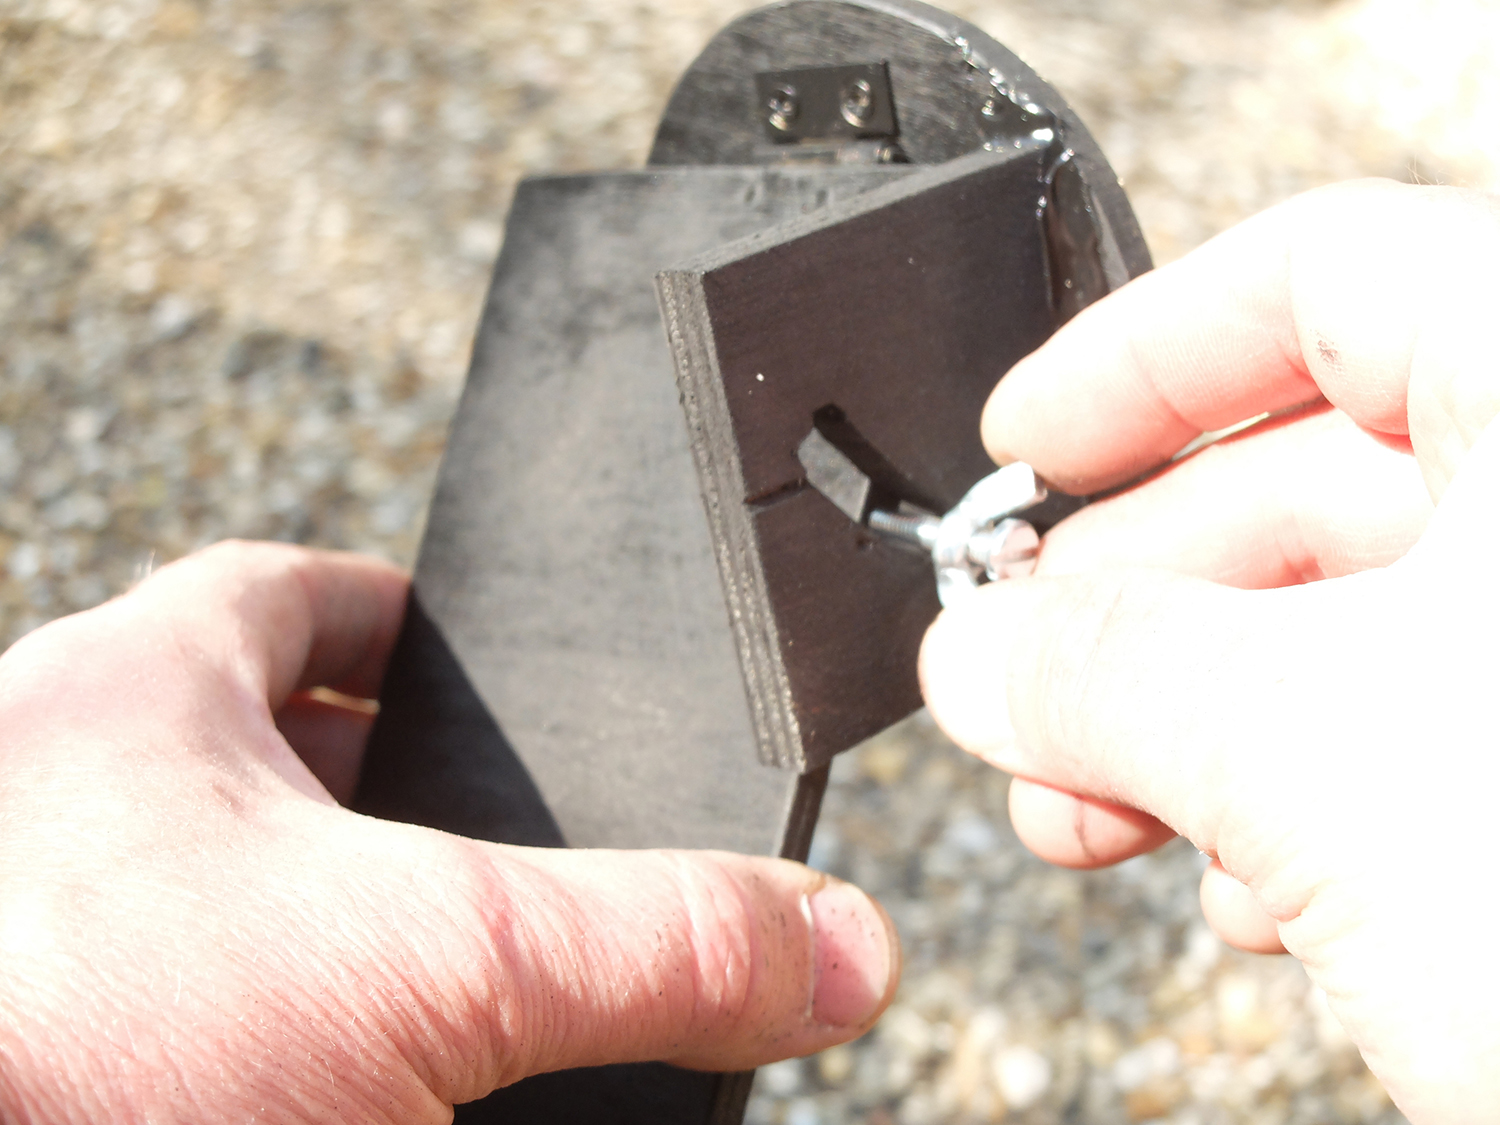
We calculated that with a standard CDR the violet end of the spectrum is deviated by 14˚ and the red end by 28˚, so our phone platform (and grating) can be adjusted to meet the beam at about 21˚ off axis, centralising the resulting image of the spectrum.
If you aim your spectrograph at a fluorescent tube or an LED, you will see an emission spectrum of distinct bands of colour (see the inset in the image at the very top of this page). These correspond to chemical elements which are excited and giving off photons of light.
When we recorded the Sun’s spectrum, we were able to observe Fraunhofer lines – narrow, dark bands in the continuous ‘rainbow’ (an absorption spectrum), caused when elements in the Sun’s outer layer absorb certain wavelengths of white light emitted from within.
It’s also possible to use software to calibrate your spectrograph and measure the wavelengths of the spectrums you image. We experimented with spectral-workbench, a free online resource found at www.publiclab.org.
We hope you enjoy making and using your first spectrograph and, if you want to take things further, there is a thriving community of amateur observers doing spectroscopy that you can tap into.
Tools and materials
- Marking out tools (ruler, compasses and pencil), coping saw, drill and range of bits, tin snips, screwdriver and glue gun
- A small quantity of 6mm plywood or equivalent (approximately A4 size), a sturdy tube with a lid and base and a strip of thin wood for the phone surround
- Sundries include a blank CDR disc; a small hinge and screws, M4 x 25 screws with wingnuts and washers; a small amount of stiff card
- Dark tape or craft foam for masking stray light and a rubber band
- For the finish you’ll need some matt black spray paint for the interior of the tube, plus saw dust and paint suitable for the other parts.
