When your astro imaging opportunities are limited, less than ideal data maybe the only way to gather enough to process.
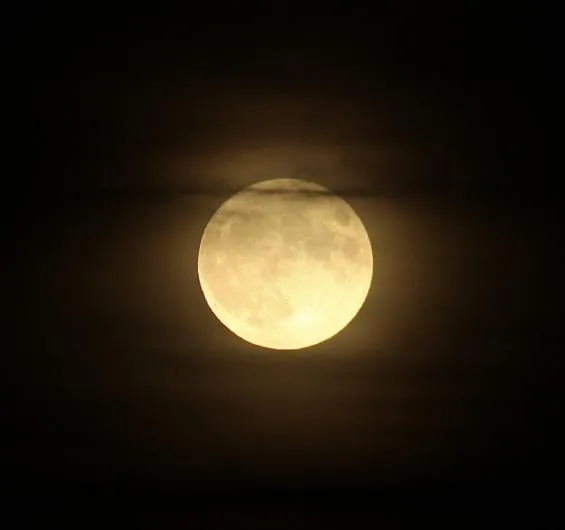
In this article we'll explore how to work with astronomical images that normally would not get used or taken at all, such as when there is high haze or moonlight, where the higher background brightness can drown out faint details.
To explore whether data taken under poor conditions is worth using, we took images under the harshest combined conditions for imaging: moonlight and an added luminance filter.
We recorded data of the Pacman Nebula in Cassiopeia over two nights, taking some images affected by lunar glare and some images without any glare on each evening.

That way the conditions for the data were as similar as possible.On the nights in question the Moon was 75 per cent and 66 per cent illuminated.
The equipment used was a 6-inch refractor, a camera with a Sony ICX814 sensor and a Hutech IDAS light pollution filter that we routinely use to gather luminance data.
Each dataset consisted of 27 10-minute exposures and three data sets were used.
For more astrophoto tips, read our guide on how to photograph the stars and find out which are the best cameras for astrophotography and the best telescopes for astrophotography.
Or if you're only getting started, read our beginner's guide to astrophotography.
If you want to photograph a full Moon, find out when the next full Moon is visible

Each was calibrated using a bias, flat and bad pixel map in Astro Pixel Processor with default settings except Winsor Sigma Clip being set to ‘In filter’ (Integrate > Outlier Rejection > Winsor Sigma Clip) and Kappa Sigma Clip being set to greater than two (Integrate > Outlier Rejection > Kappa Sigma Clip).
We needed to make sure that the data was all treated equally, so we opened it in PixInsight to complete equal crops (Process > Geometry > Dynamic Crop), equal background equalisation (Process > Background Modelization > Dynamic Background Extraction), and equal stretches (Process > Intensity Transformations > Screen Transfer Function > Auto Stretch).
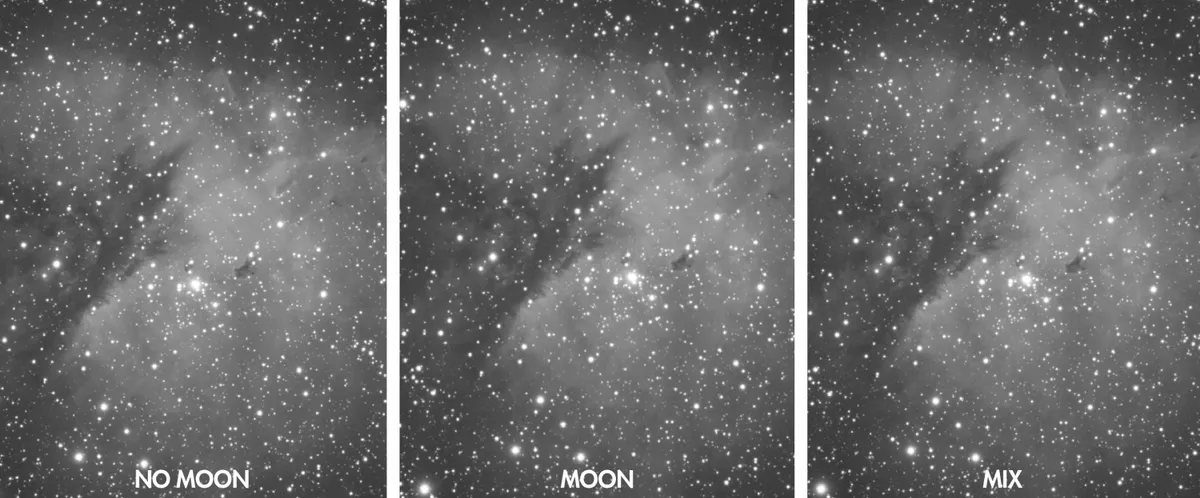
At the end, we had three datasets: the first 27 processed 10-minute exposures of moonless data; the second 27 processed 10-minute exposures of Moon-affected data; and the third a mixed set of the two, 14 of moonless data and 13 of Moon-affected data.
It’s interesting to see that there are small, subtle differences between the datasets.
In the Moon-affected data there is slightly more visual noise but a little less contrast, leading to a flatter looking image, but this can be dealt with in processing.
The moonless data has a slightly darker background and appears more balanced.
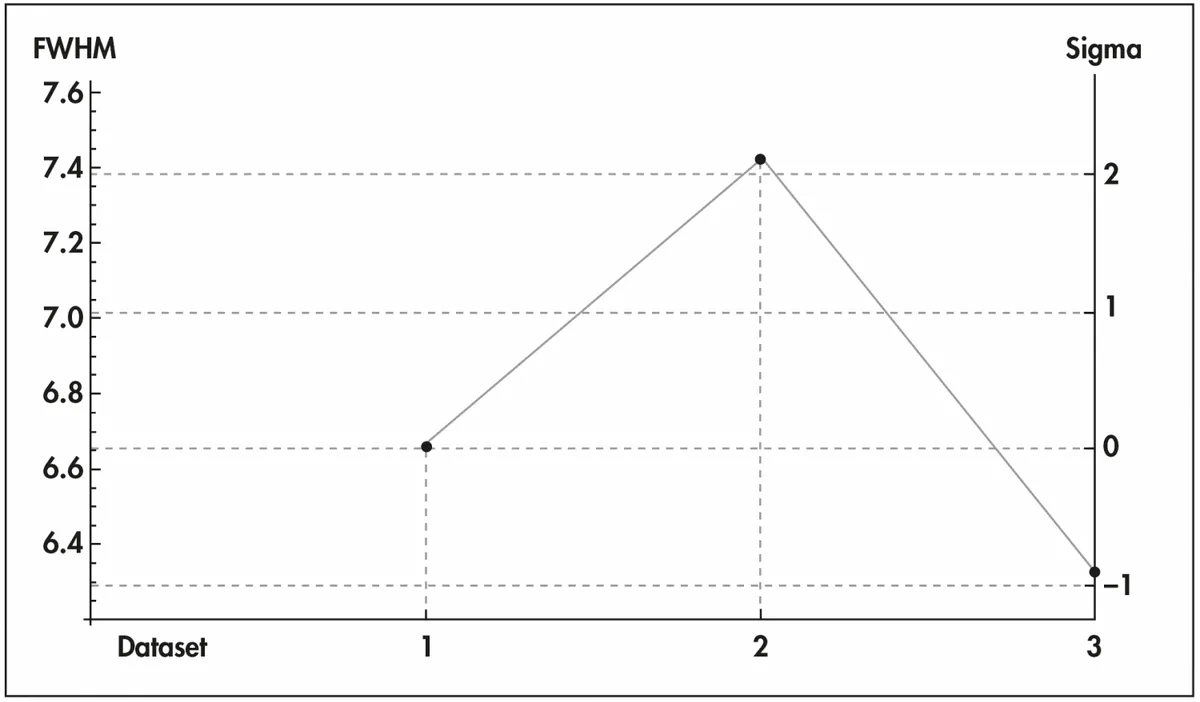
When looking at the crop of the datasets, the stars appear to be slightly smaller in the moonless images; something we confirmed using the Subframe Selector script in Pixinsight (Script > Batch Processor > SubFrame Selector).
In the graph on below, dataset 1 is the mixed data, 2 Moon-affected data and 3 moonless data – you can see that the FWHM (full width, half maximum) figure, a measure of focus and star size, is smallest in the moonless data.

This is because, despite the sky conditions being the same across the two types of data, the moonlight has a negative effect on overall guiding, leading to bigger stars and potential loss in sharpness.
The interesting option is the mixed data set consisting of 14 moonless and 13 Moon-affected exposures.
The difference between this dataset and that of the moonless data is negligible; from this, it seems that it is worth keeping all of your data and combining it in equal measure.
There are some caveats to this experiment. The data was not collected when the Moon was full, but there are people who will not collect any broadband data (LRGB) when the Moon is about at all.
Perhaps ‘some’ Moon, with a carefully selected target, need not be quite the data killer that we expect when combined with good data.
The best approach when the Moon is in the night sky is to use a monochrome camera and a hydrogen-alpha filter.
The narrower the bandwidth (3nm compared to 7.5nm, for example), the better it will combat moonlight.
Bright nebulae tend to have lots of hydrogen-alpha signal in them, whereas galaxies and reflection nebulae contain almost none.
As a result, we wouldn’t bother trying to collect hydrogen-alpha data on such targets.
Globular clusters, on the other hand, can be imaged in LRGB even when the Moon is full for very satisfactory results.
All 20 hours of data in the image of M56 at the top of this article was acquired throughout a full Moon period. There’s no detrimental lunar influence on the image.
This article originally appeared in the February 2018 issue of BBC Sky at Night Magazine. Sara Wager is an amateur astronomer who loves imaging nebulae in narrowband.