Photometry and spectroscopy can contribute significantly to the scientific study of the cosmos. Photometry in particular is an important tool used in many areas of astronomy.
These topics have significant depth to them and here we offer a general overview of their capabilities and practices to get you started.
Deep-sky imaging is a term that essentially covers everything we can see outside of our own Solar System.
As well as the usual suspects such as galaxies, nebulae and clusters, it also includes the study of individual and multiple stars.
Read more:
Much of the work here involves converting the light from these objects to produce numbers that can be subsequently analysed as data.
Variable stars are a classic example; by accurately measuring their magnitude it’s possible to generate a light curve of their activity and deduce a lot about their nature.
Very precise measurements of a star’s light may also contribute to exoplanetary science by recording the tiny dip in light that occurs when a planet transits its sun.
Measuring the intensity of light across a star’s spectrum provides another exciting area of research where amateurs can make real contributions to the scientific data pool.
High-speed photometry is another important area for research and recently came to the fore with observations of V404 Cygni in June 2015.
The rapid brightness flickering that was recorded by amateurs with 200mm or larger telescopes represented the visible light output from the accretion disk around a black hole.
This was the first time such flickering had been detected in the visible part of the spectrum.
Photometry at a glance
Photometry is the science of measuring light. The light received from a source object such as a star is recorded on a camera’s chip and ultimately converted into an image.
The data behind the image holds a value that can be used to work out a star’s brightness.
Objects such as variable stars have magnitudes that vary over time. Photometry can be used to determine accurate variable star magnitudes by comparing the variable’s image with that of fixed-magnitude comparison stars.
For accuracy it is important to deduce the noise contribution from your camera’s electronics, the spectral response of your camera’s sensor and optical factors from your telescope’s optics and the atmosphere you’re imaging through.
A CCD’s response to light is linear. Blooming occurs when a pixel over-saturates.
Typically this produces a cascade of charge from one pixel to the next, resulting in line artefacts spreading out from the star.
CCDs with anti-blooming gates (ABG) correct this issue but truncate the CCD’s linear response.
Exposing below the saturation limit for an ABG sensor still allows it to be useful for photometry.
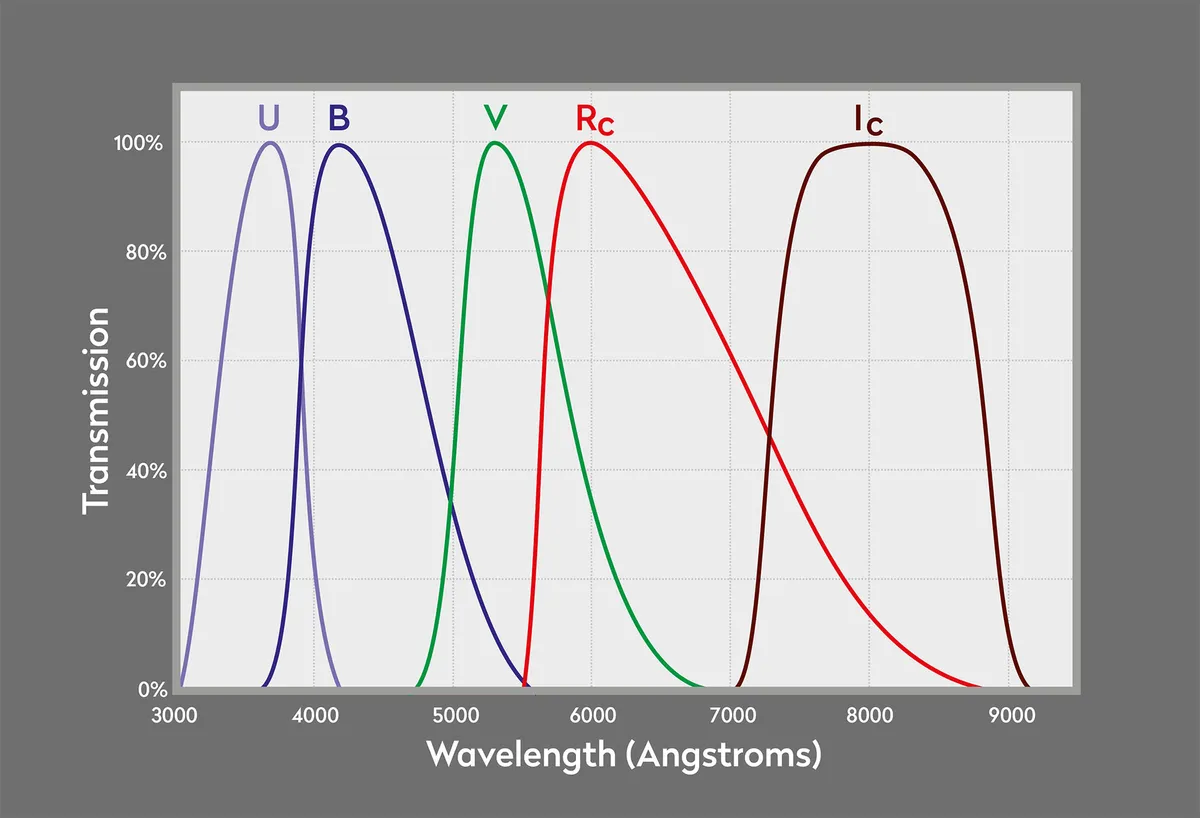
Serious photometric study involves the use of standard filters, the most common being those developed by Harold Johnson and Alan Cousins.
Often used by amateurs is the Johnson V filter, which produces results similar to visual observations.
Also available are Johnson B, Cousins I, Cousins R and Johnson U, listed in order of usefulness.
Images for photometric analysis should be calibrated. Once acquired, they should also be checked for anomalies such as satellites, planes or even clouds.
The stars in the image should be identified either using astrometric software (plate-solving) or by using photometric charts for specific variables.
Measurement of star brightness is normally performed using an ‘aperture’.
This comprises a central circle sized to contain all of the light of a star surrounded by an annulus or ring separated by a small gap.
The same size aperture must be used to measure the variable and its comparison stars.
Tools required
Hardware
- Telescope
- Equatorial mount
- Autoguider
- Camera (DSLR, cooled astronomical CCD, high frame rate)
- Laptop
Software
- Maxim DL
- AIP4WIN
- AstroimageJ
- RSpec
- PixInsight
- APT
- Sequence Generator Pro
Making a start in photometry
Photometry is the science of measuring light. The light received from a source object such as a star is recorded on a camera’s chip and ultimately converted into an image.
The data behind the image holds a value that can be used to work out a star’s brightness.
Objects such as variable stars have magnitudes that vary over time. Photometry can be used to determine accurate variable star magnitudes by comparing the variable’s image with that of fixed-magnitude comparison stars.
For accuracy it is important to deduce the noise contribution from your camera’s electronics, the spectral response of your camera’s sensor and optical factors from your telescope’s optics and the atmosphere you’re imaging through.
A CCD’s response to light is linear. Blooming occurs when a pixel over-saturates.
Typically this produces a cascade of charge from one pixel to the next, resulting in line artefacts spreading out from the star.
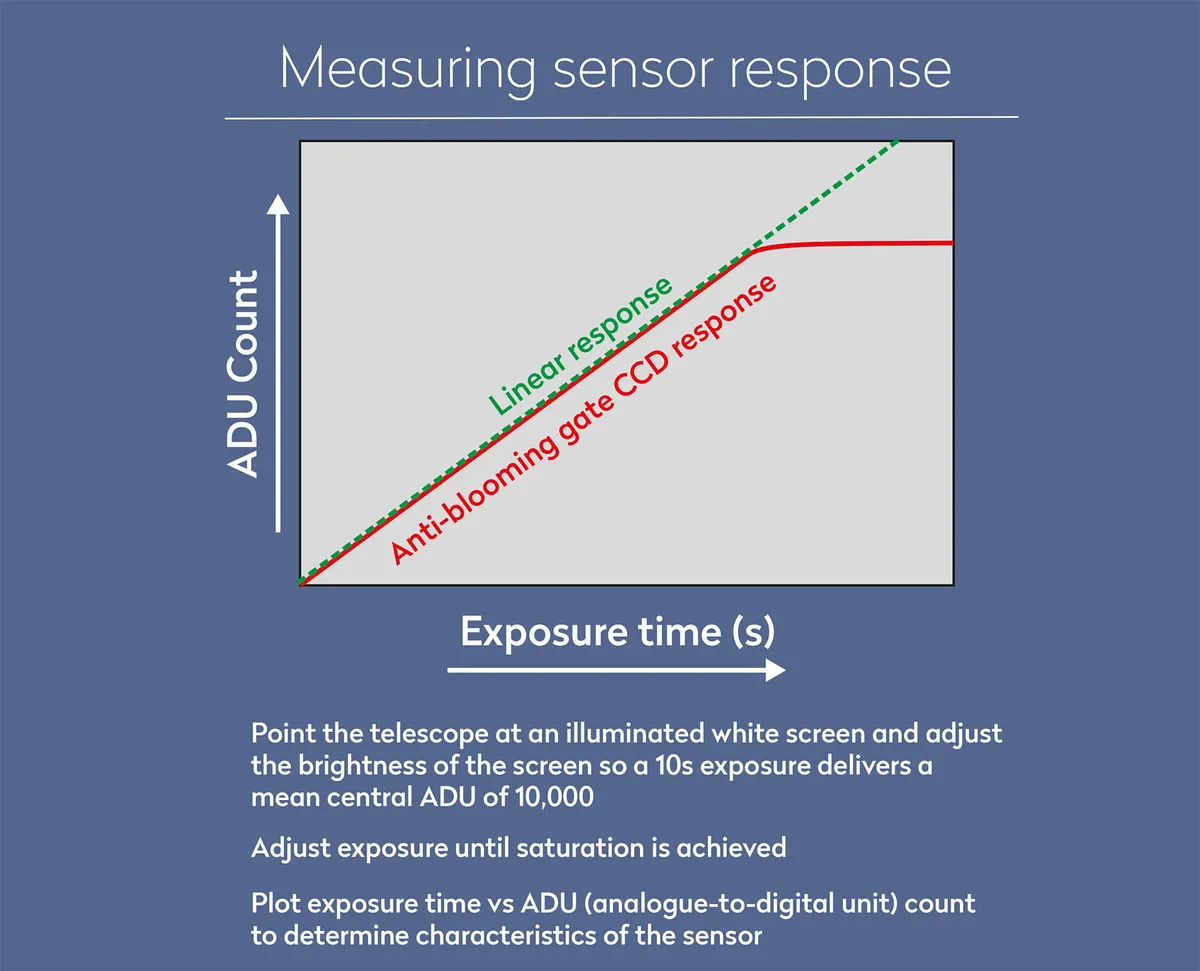
CCDs with anti-blooming gates (ABG) correct this issue but truncate the CCD’s linear response.
Exposing below the saturation limit for an ABG sensor still allows it to be useful for photometry.
Serious photometric study involves the use of standard filters, the most common being those developed by Harold Johnson and Alan Cousins.
Often used by amateurs is the Johnson V filter, which produces results similar to visual observations.
Also available are Johnson B, Cousins I, Cousins R and Johnson U, listed in order of usefulness.
Images for photometric analysis should be calibrated. Once acquired, they should also be checked for anomalies such as satellites, planes or even clouds.
The stars in the image should be identified either using astrometric software (plate-solving) or by using photometric charts for specific variables.
Measurement of star brightness is normally performed using an ‘aperture’.
This comprises a central circle sized to contain all of the light of a star surrounded by an annulus or ring separated by a small gap.
The same size aperture must be used to measure the variable and its comparison stars.
Split light to reveal the hidden signatures of stars
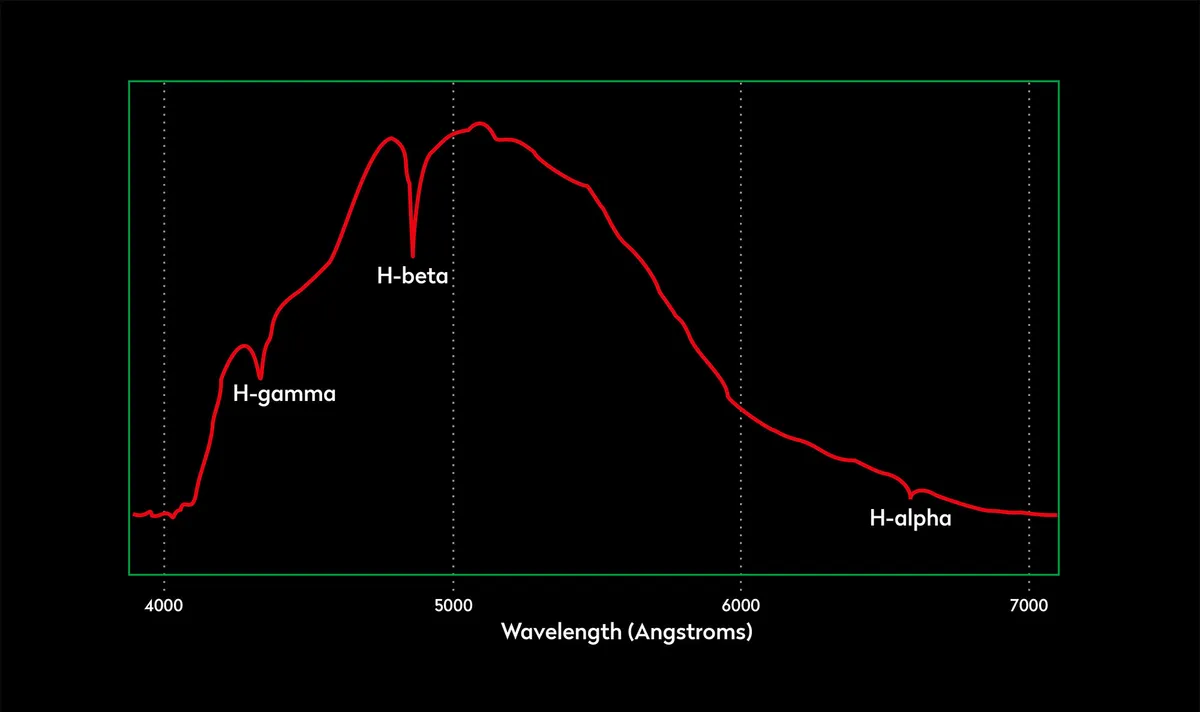
Astronomical spectroscopy is the science of analysing the spectrum of an object’s light.
It’s an important and fundamental part of analytical astronomy that can yield very valuable results.
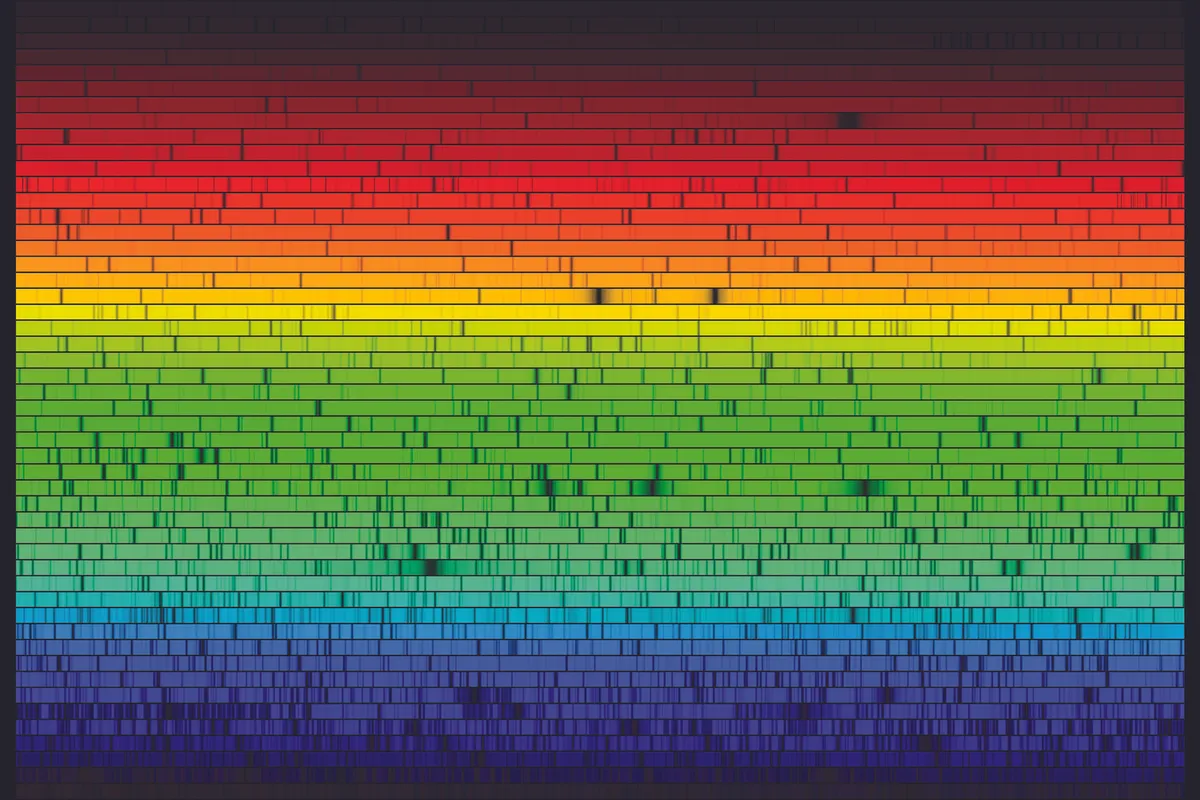
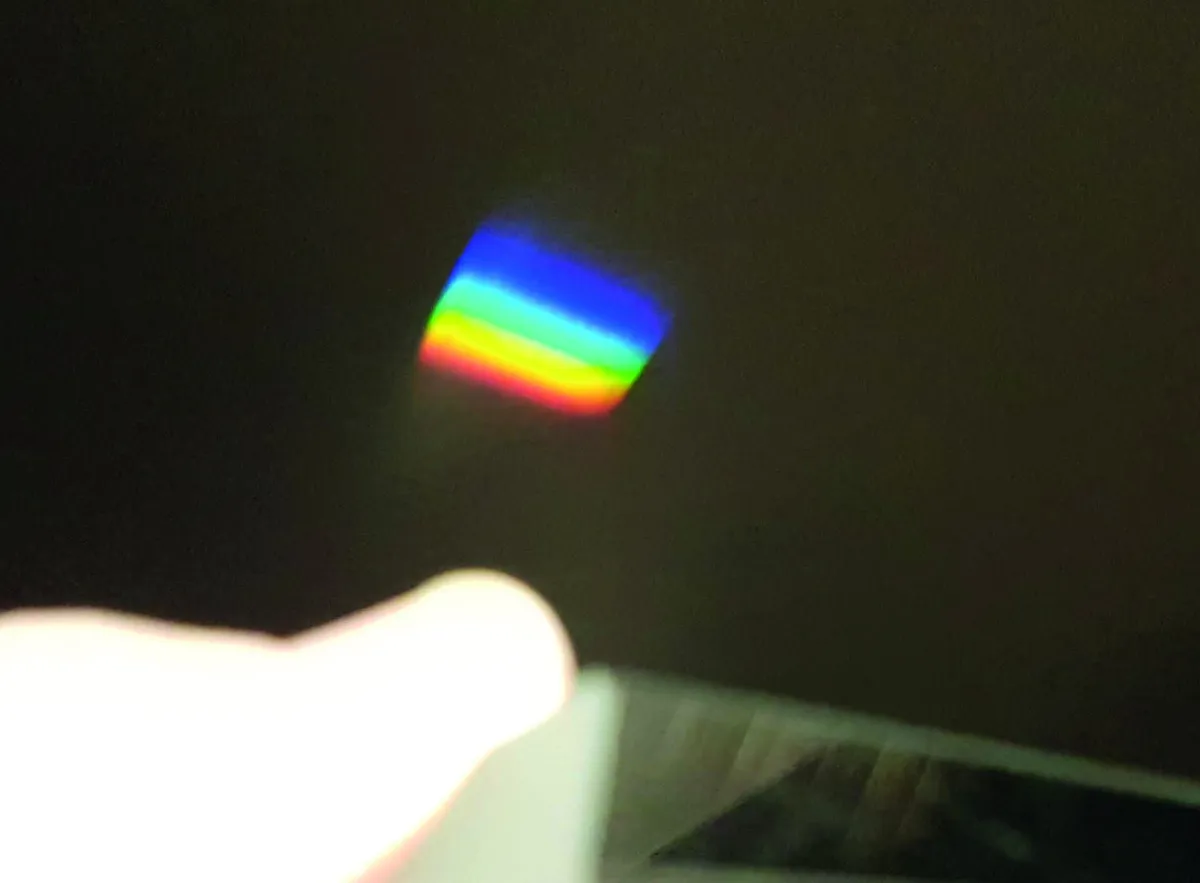
Starlight is composed of different wavelengths of light. Passed through an optical dispersion device such as a diffraction grating or prism, the light is spread out into the object’s unique spectrum.
This ‘signature’ spectrum can tell us the temperature of the star’s outer atmosphere and the chemical composition of the star’s outer layers.
In addition, starlight interacting with another medium can produce variation in spectra over time and recording this in a rigorous scientific manner can make a significant scientific contribution.
An excellent example of such an observation was during the last eclipse of binary Epsilon (ε) Aurigae in 2009–2011.
Here the spectroscopy research done by non-professional astronomers helped uncover never-before-measured variations in the composition of the unknown object that eclipses the primary every 27 years.
Basic spectroscopy involves nothing more than a simple dispersion element added in front of a camera.
One easy-to-use example is a product called Star Analyser, which is available as a 1.25-inch filter costing around £200.
This fits in front of a camera and produces a spectrum for analysis using specialist software such as RSpec.
The beauty of this system is that it can be used with a wide variety of cameras, including readily available DSLRs.
The important thing to get right with spectroscopy is calibrating the results so they are not skewed by the equipment or conditions.
This is where choosing the right analytical software becomes very important.
For advanced analysis, instruments with greater spectral resolution such as the ES0002-Lhires III, a high-resolution spectroscope from Shelyak Instruments, can be used.
However, these devices will typically require a much higher investment.
Supernova hunting
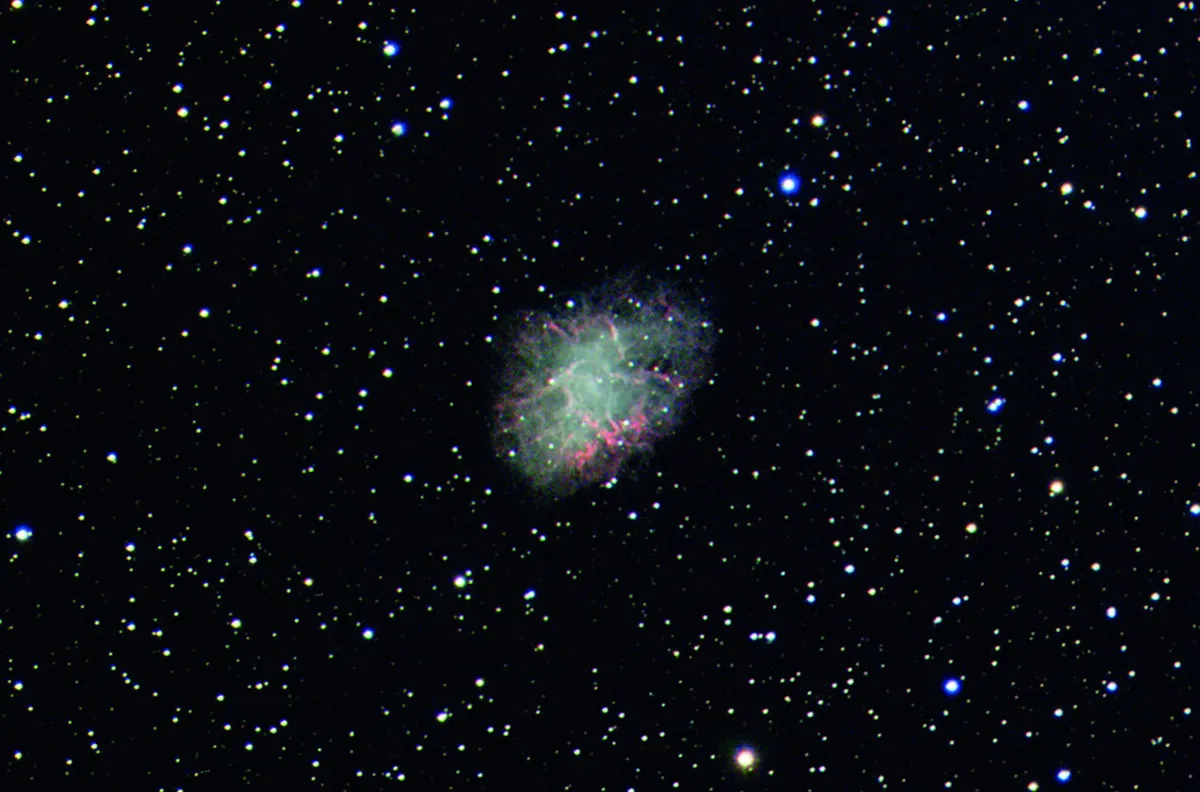
Supernovae are energetic outbursts associated with the death of certain stars. Only three have ever been observed in our own Galaxy, the last being in 1604.
Most are detected in external galaxies. Even here, their occurrence is infrequent and the best way to detect them is by supernova patrols that systematically image a sequence of selected galaxies.
The images taken are compared to the ‘normal’ view of the galaxies in the hope that a supernova appears as an extra star.
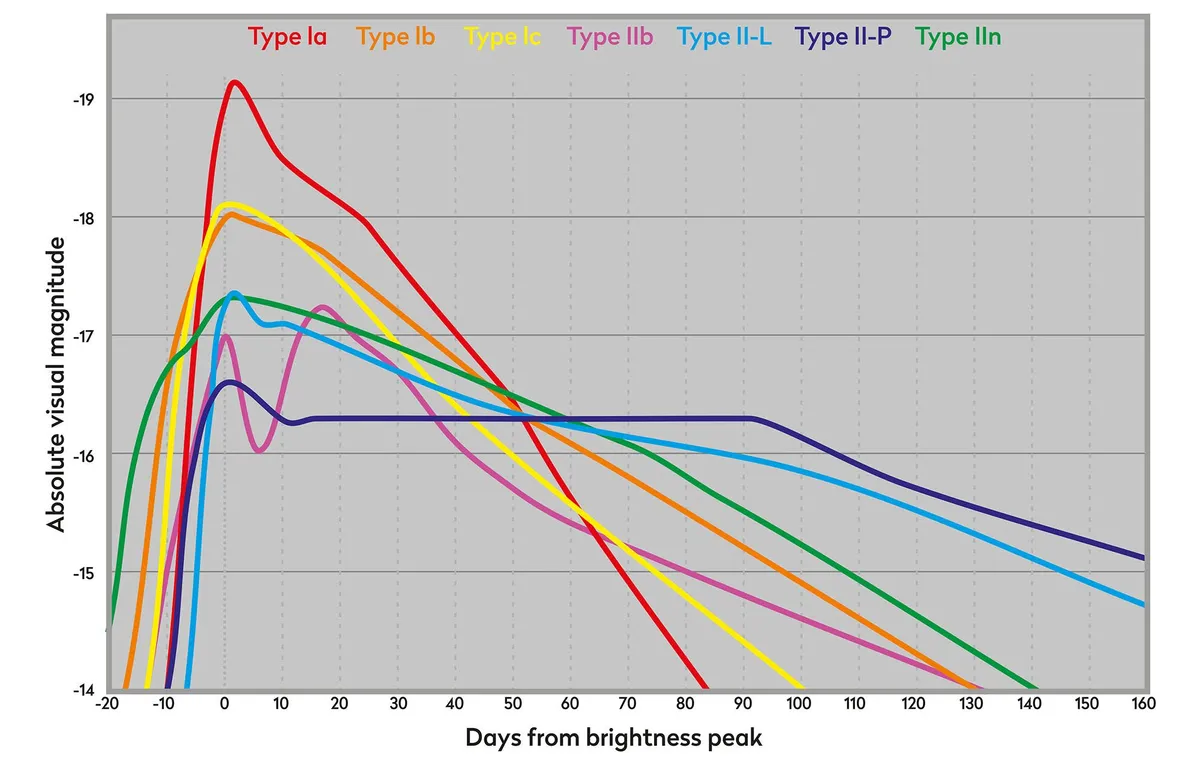
Should a supernova be detected, analysis of its light curve will, if done accurately, provide important information that allows the supernova type to be determined.
There are various kinds of supernova, each having characteristic light curves that reveal the nature of the system that has exploded.
Once identified, the application of photometric analysis on a supernova will provide a lot of useful information about what actually happened.
A Type Ia supernova is thought to occur when a white dwarf star in a binary system accretes enough material from its companion to collapse.
Some speculate that the accretion may be insufficient for total collapse, instead causing carbon fusion within the star’s core.
A non-standard Type Ia supernova describes the coalescence of two white dwarfs creating enough mass for collapse to occur.
Type II supernovae occur when a massive star runs out of fuel. The core is unable to support the star’s outer layers and collapse occurs, resulting in the star blowing itself apart.
Further variations exist, making it extremely important to use accurate photometry to ‘document’ the profile of the supernova’s light curve and so determine its type.
Contributing to supernova science doesn’t necessarily involve a heavy investment in time or equipment.
The Zooniverse website, for example, lets you check bulk collected galaxy images from
the Pan-STARRS1 survey system without even owning a telescope.
Visit www.zooniverse.org/projects/dwright04/supernova-hunters and see how you can contribute to this important area of astronomical science.
Pete Lawrence is an experienced astrophotographer and a co-host of The Sky at Night. This article originally appeared in the February 2019 issue of BBC Sky at Night Magazine.
