Many of us dream of a night sky over a city unaffected by light pollution. While this might seem an impossibility, one outcome of COVID-19 and national lockdowns during the pandemic has been a ‘natural experiment’ on the relationship between human activity and our effect on the environment.
Satellite observations revealed a drop in atmospheric levels of nitrogen dioxide (a major air pollutant released by the burning of fossil fuels) over cities and industrial centres, and levels of ‘PM10’ sooty particles in the air were also greatly reduced.
But what effect are the restrictions around coronavirus having on light pollution?
The main source of information on global night-time light emissions is the Visible Infrared Imaging Radiometer Suite (VIIRS) instrument aboard the Suomi NPP satellite.
For more advice, read our guides on the best light pollution filters for telescopes and how to capture astrophotos from a light-polluted city
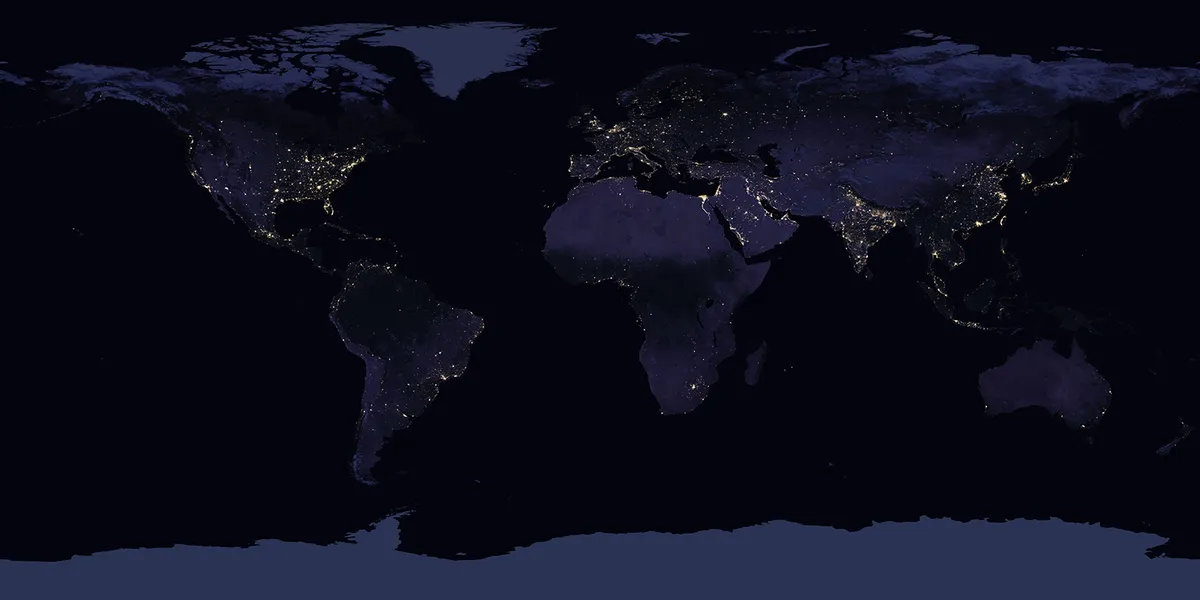
But the problem with using this dataset to compare light pollution before and during the pandemic is that the images are taken by the satellite passing overhead at 1:30am local time, long after most people have already gone to sleep and lights are turned off.
As Máximo Bustamante-Calabria at the Astrophysical Institute of Andalucía explains, the key to uncovering the effects of human activity is in combining this satellite imagery with local ground measurements of sky brightness.
He and his team have collected this data for the city of Granada in Spain, including both before the pandemic and during the lockdown from mid-March to the end of May 2020.
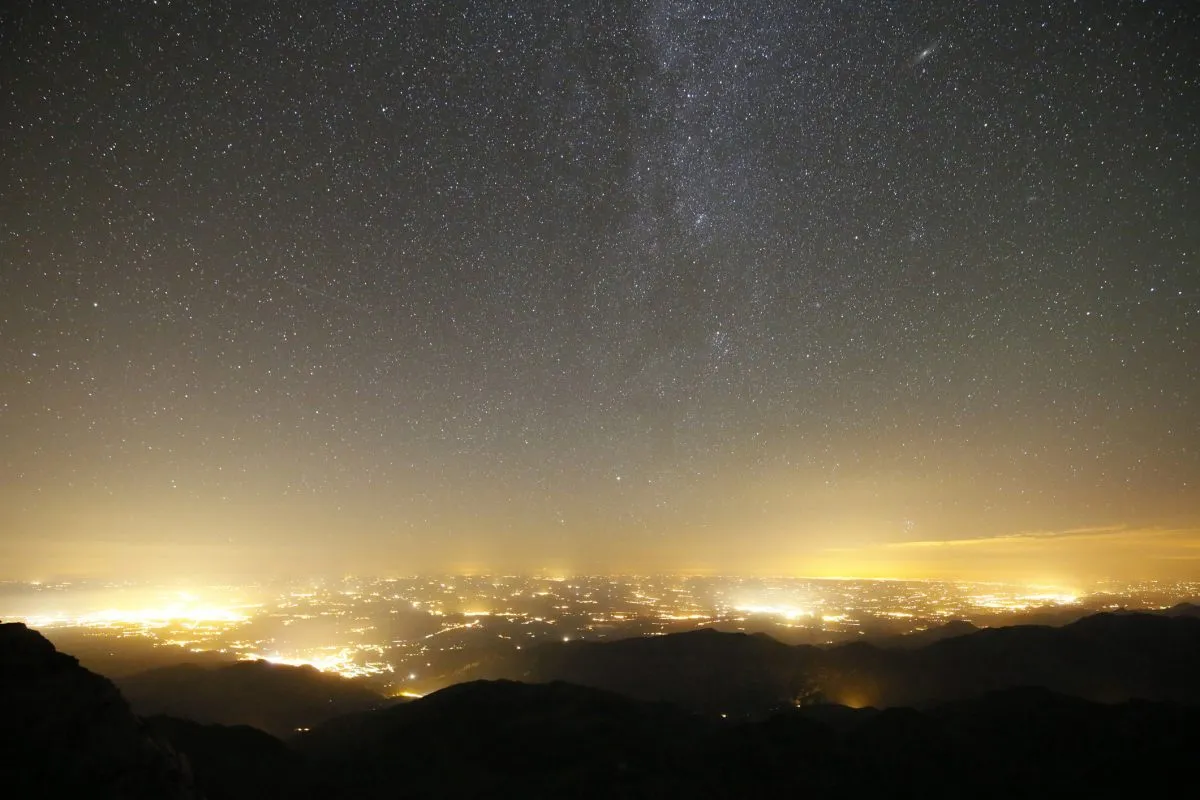
As many amateur astronomers know, the problem of light pollution on the night skies is not just the amount of artificial lighting, but also the haze of PM10 particles in air pollution reflecting that glow back towards the ground.
So Bustamante-Calabria and his team had to first disentangle the relationship between the lower levels of particle pollution in the air scattering light, and any decrease in the amount of artificial lighting during the pandemic.
When they allowed for these variations, the data revealed that during lockdown the overall light output of the city had decreased by around 20%.
The drop is even more pronounced in the blue end of the light spectrum, where the team measured a 45% decrease in sky brightness during the lockdown.
This is due to the reduction in vehicle headlights and private lighting, as well as the ornamental illumination of city monuments.
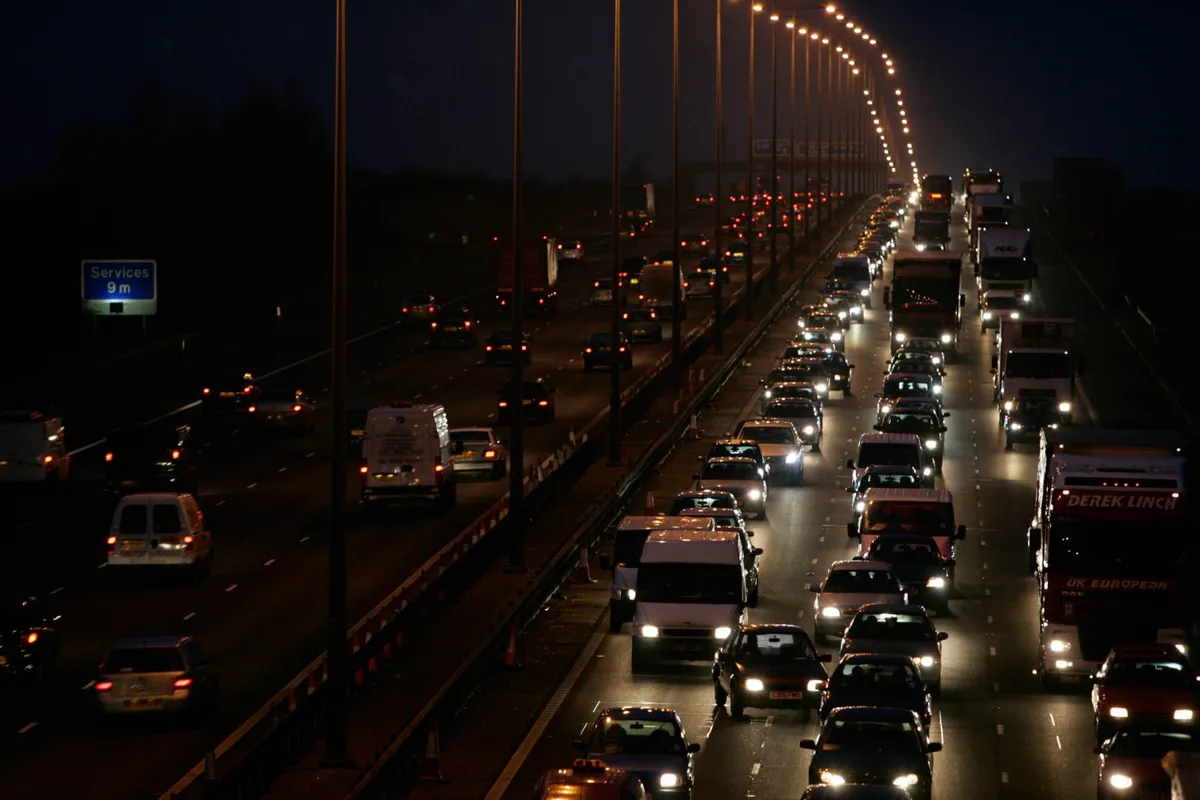
Nowadays, these are usually metal halide or LED lamps that produce a blue-white light, rather than the yellowy colour of sodium lamps (for more on this, read our guide to the best lighting to minimise light pollution).
Most of these lights are turned off by the early hours, however, and so are missed by the satellite imagery. VIIRS data doesn’t record any significant difference in the light emission of cities before and during lockdown.
Given that outdoor activity decreased by up to 90% during lockdown, Bustamante-Calabria concludes that the late-night emissions of the city are dominated by permanent lighting that doesn’t respond to the actual behaviour of its citizens.
This, he argues, is a clear waste of energy and resources, as well as being a source of frustration for many amateur astronomers.
What does ESA data tell us about lockdown light pollution?
Words: Iain Todd
According to new satellite data from the European Space Agency (ESA), one of the many impacts of the COVID-19 outbreak has been a drop in air pollution.
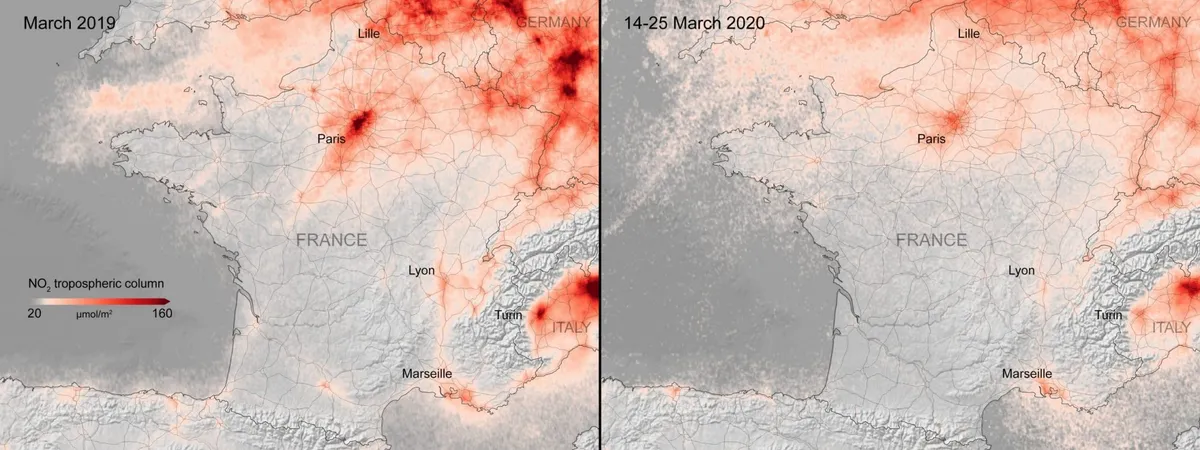
ESA's Copernicus Sentinel-5P satellite has been mapping air pollution across EuropeandChina, and the data shows a reduction in concentrations of nitrogen dioxide - such as that released by industry, vehicles and air travel - that coincide with lockdown measures imposed by governments across the world.
ESA satellite images below represent concentrations of nitrogen dioxide from 14 to 25 March 2020, compared to average monthly concentrations from 2019.
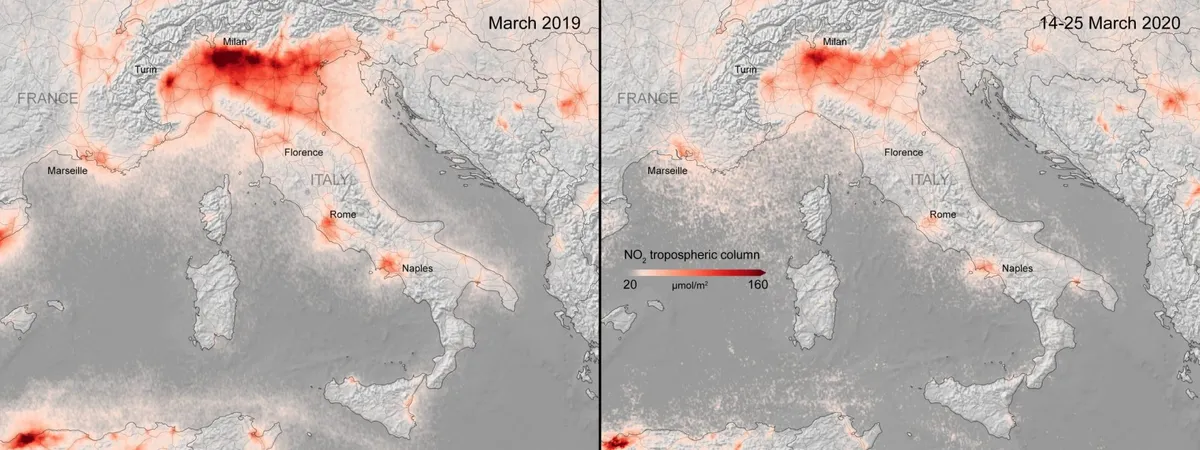
"The nitrogen dioxide concentrations vary from day to day due to changes in the weather," says Henk Eskes, a scientist from the Royal Netherlands Meteorological Institute (KNMI), explaining why that specific date range was chosen. "Conclusions cannot be drawn based on just one day of data alone.
"By combining data for a specific period of time, 10 days in this case, the meteorological variability partly averages out and we begin to see the impact of changes due to human activity."
The Copernicus data could mean clearer skies for astronomers, as a reduction in nitrogen dioxide points to a correlative reduction in heavy industry, traffic and, perhaps most notably for astronomers and those who enjoy a spot of astrophotography, less air traffic leaving trails across the sky.
Lockdown could also mean a reduction in light pollution from towns and cities, as office buildings close, evening traffic jams lessen and large-scale gatherings that would normally require extensive illumination are cancelled.
But while the effects of the lockdown on air pollution are clear, it remains to be confirmed whether astronomers are truly seeing a notable benefit.
Stargazing aside, ESA's satellites continue to monitor air pollution levels across Europe and the rest of the world, providing even more data into the effects of the coronavirus shutdown on air quality.
"The long-term cooperation between ESA and KNMI proves very valuable and shows the importance of complementary analyses by different partner organisations," says ESA’s Director of Earth Observation Programmes, Josef Aschbacher.
"As we can see, the Copernicus Sentinel-5P satellite is the best satellite equipped to monitor nitrogen dioxide concentrations on a global scale."
Keep up to date by with air pollution monitoring via ESA's dedicated Air Pollution website. And if you have noticed a change in observing conditions, let us know by contacting us at contactus@skyatnightmagazine.com.
Iain Todd is BBC Sky at Night Magazine's Staff Writer.
Prof Lewis Dartnell is an astrobiologist at the University of Westminster.
Lewis Dartnell was reading Effects of the COVID-19 lockdown on urban light emissions: ground and satellite comparison by Máximo Bustamante-Calabria. Read it online at arxiv.org.


