Galaxies are funny beasts. They should be simple systems, and yet answering even basic questions about their formation ties astronomers in knots.
Sure, their scale is breathtaking – the Milky Way’s few hundred million stars are nothing to be sniffed at – but the shapes of galaxies, and the patterns of the star formation that takes place within them, are sculpted almost entirely by gravity.
We understand gravity and yet, while astronomy's Great Debate of 1920 saw a turning point in our understanding of distant galaxies, generations of astronomers since then have struggled to explain exactly what we're seeing.
Part of the problem, of course, is the distance of the galaxies we’re trying to study. Trying to understand the behaviour of systems hundreds of millions of lightyears away requires some ingenuity and a paper by Tom Peterken and friends at the University of Nottingham and elsewhere, makes excellent use of a powerful new type of instrument.

MaNGA is an IFU (integral field unit) – a camera that provides a spectrum for many points across the image.
The idea is that we get a three-dimensional view of the system, as these spectra enable us to tell how gas and stars are moving.
The team are also able to use the spectra to gain insights into the history of star formation in each part of the galaxy.
They do have to assume that things don’t get too mixed up over the course of billions of years, but if you make the assumption that stars stay roughly where they form, you can use an instrument like MaNGA to chart a galaxy’s history.

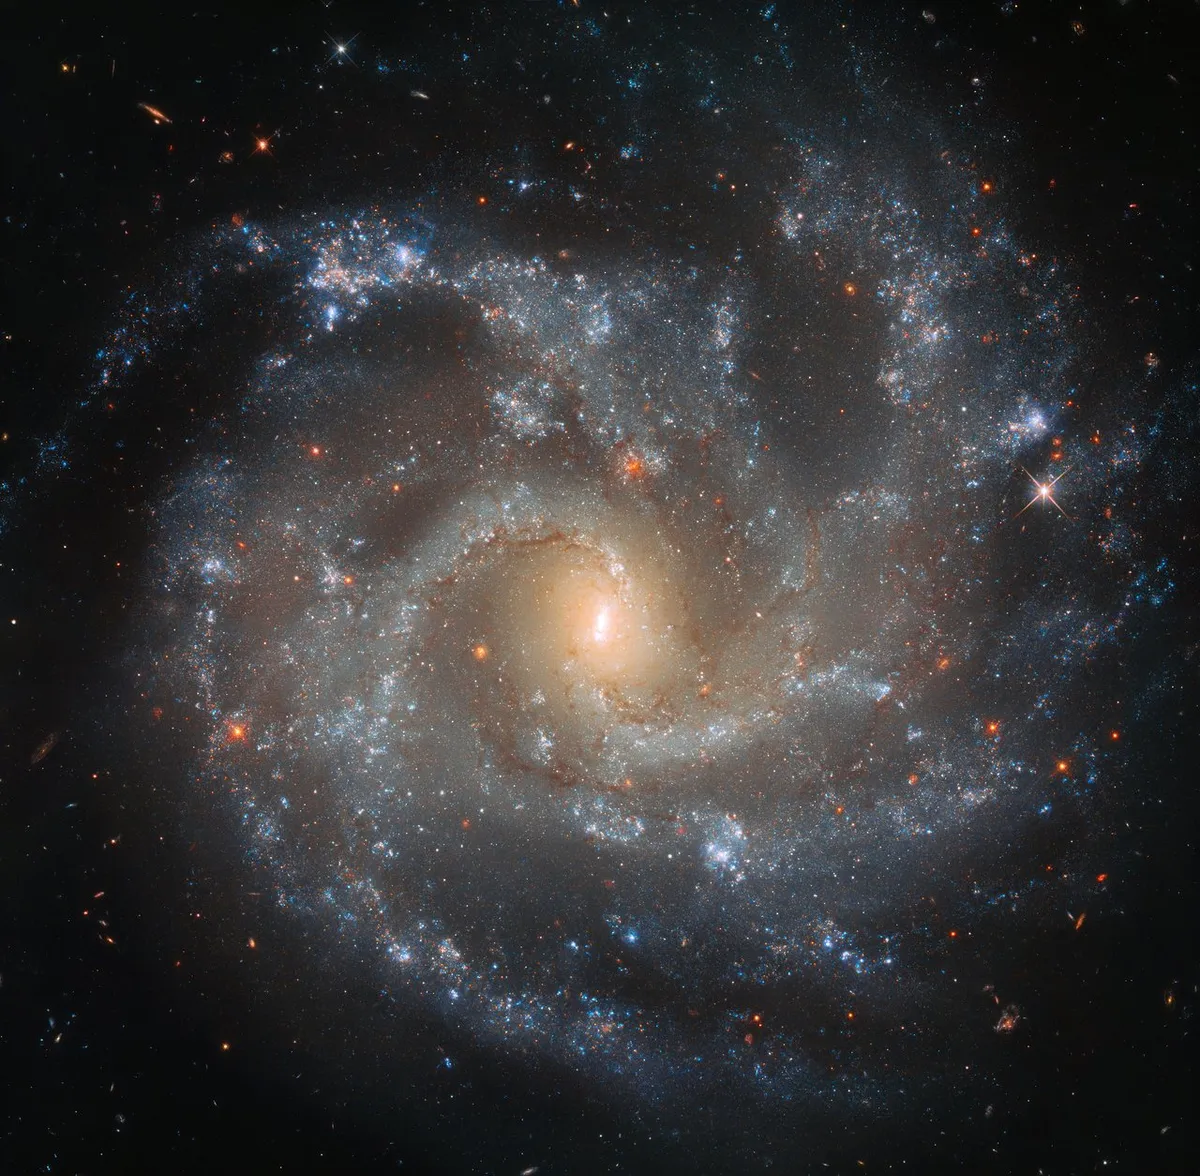
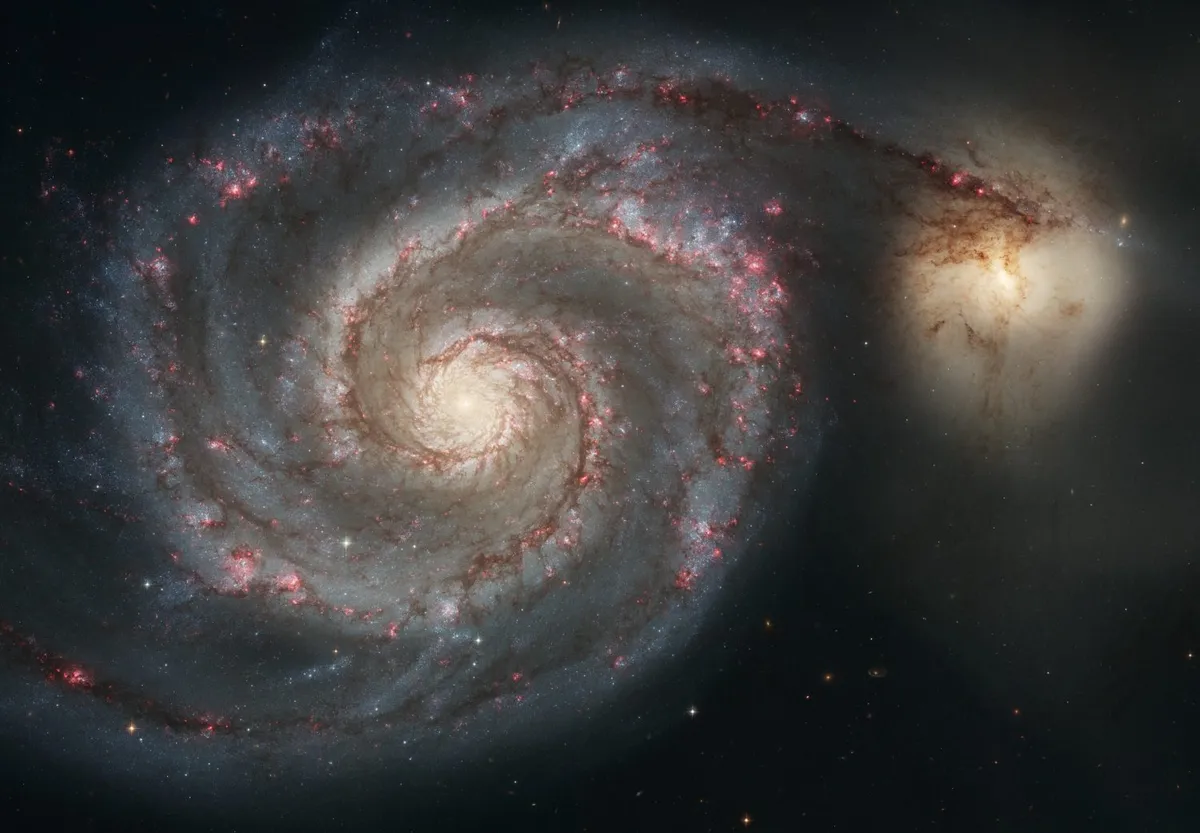
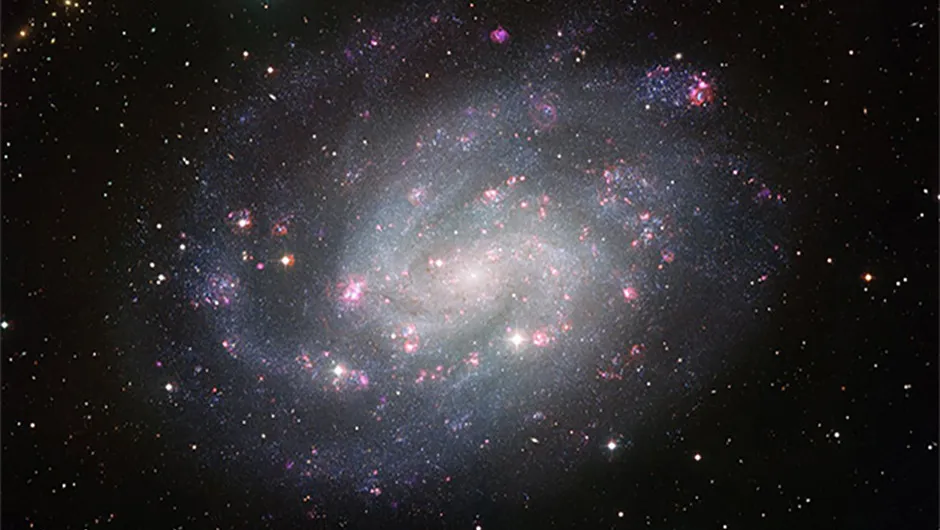
That’s what this paper does, focusing on 800 nearby spiral galaxies. Though each individual galaxy is somewhat different, with its own story to tell, they find a remarkable degree of consistency when it comes to stellar age distribution.
For these galaxies, the younger stars are spread further than the older stars, which tend to cluster towards the centre of the galaxies.
This isn’t entirely surprising – many spiral galaxies have a central bulge, which tends to be populated with older stellar populations – but it is shown much more clearly in this careful treatment of the data than it has before.
The explanation for this pattern – old stars in the middle and young further out – is that star formation seems to have happened in an ‘inside out’ fashion, working its way from the denser centre of the galaxy to its outskirts.
This is particularly true for the more massive spirals, where perhaps the differences between central and outlying regions are most profound.

Interestingly, the story told by the star formation histories may not reflect what’s going on underneath.
If you look only at the stars, then as star formation moves outwards over time galaxies seem to grow, but it turns out the underlying distribution of matter isn’t changing at the same rate.
If we’re too distracted by the sparkling of new stars, we miss the underlying picture.
This consistency is also good news for astronomers peering at more distant galaxies, as it suggests that the most massive galaxies we observe, say, from four billion years ago, are still the most massive today.
That knowledge should make it easier to follow the course of galactic growth directly, as we continue to tackle the mysteries of these beautiful and maddening objects.
This article originally appeared in the July 2020 issue of BBC Sky at Night Magazine.
Chris Lintott was reading SDSS-IV MaNGA: Excavating the fossil record of stellar populations in spiral galaxies by Thomas Peterken. Read it at: https://arxiv.org/abs/2005.03012.
