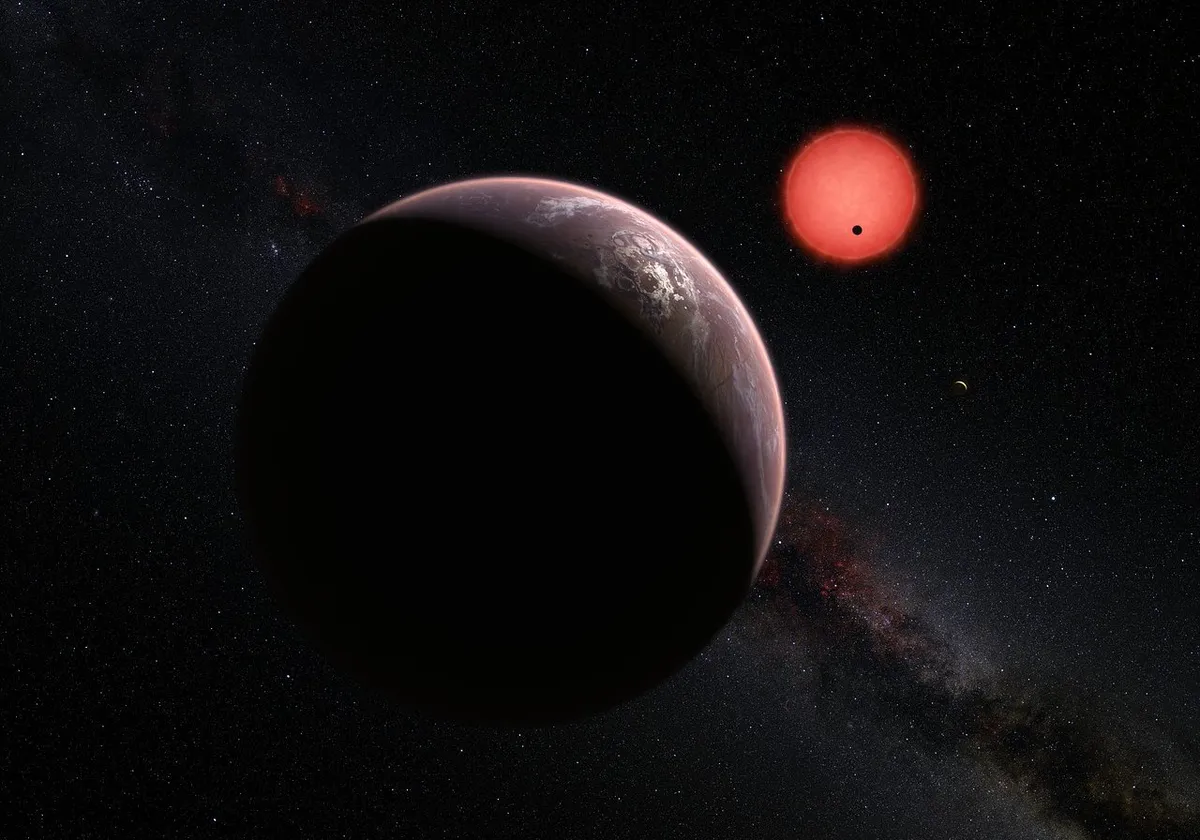
Astronomers have now discovered around 4,000 extrasolar planets, a number of which are believed to be small, rocky worlds like Earth; some of these like TRAPPIST-1e may even be habitable. The usual detection methods – radial velocity and transit – can give bulk measurements such as mass, diameter and orbital distance from the star.
From this information, astronomers can begin to make estimations about a world’s climate and whether it would be able to host oceans of liquid water on the surface.
But what we’d really want to do is to actually see such a terrestrial exoplanet – to make out its swirling clouds and continental features in the way even modest amateur telescopes can with Mars or Saturn in our own Solar System.
Read more from Lewis Dartnell:
- Does oxygen on an exoplanet indicate an Earth-like world?
- Can an exomoon make plants grow?
- Could water-rich exoplanets experience extreme cooling?
The problem is that until we have constructed huge telescope arrays in space – which will be very technically complex and expensive – we won’t be able to spatially resolve any Earth-like planets.
All we’ll have is a single pixel/point and measurements of how its spectrum changes over time.
So how might we derive surface maps of Earth-like planets from analysing these varying ‘multi-wavelength single-point light curves’ – could we watch their configuration of continents and oceans spinning under our telescopes?
Graduate student Siteng Fan and his colleagues at Caltech and JPL in Pasadena have been working on techniques for exactly this – by using degraded observations of Earth as a proxy for a habitable exoplanet and trying to reconstruct the global map.
The data they used came from the Deep Space Climate Observatory, an Earth observation satellite positioned at the first Lagrangian point between Earth and the Sun, almost 1.5 million km away.
From this vantage point the satellite’s camera, which images in 10 wavelength channels (and not just the red, green and blue of your camera phone), has a continuous view of the whole sunlight hemisphere of the planet.

Fan and his team used 10,000 separate images taken over 2016–17 and averaged each one over the entire Earth’s disc
– recreating the type of images we could take of an exoplanet.
Fan then applied statistical analyses to these simulated multiple-wavelength light curves to tease apart the signals they contained.
He was able to pick out strong periodicities in the varying spectra – on both daily (the rotation of Earth’s surface) and annual (seasonal changes between winter and summer solstice) scales.
The results showed two clearly different sets of changes – those caused by varying cloud cover across the planet, and others caused by the continents and oceans rotating into view.
From this, the team was able to recover a global view of Earth’s surface.
Although it looks pretty rough, the thought of what this could represent sends shivers down my spine.
This is the first time that a two-dimensional surface map of a planet has been derived from single-point observations, and it’s very promising for how we’ll get our first views of alien Earths.
Lewis Dartnell was reading…Earth as an Exoplanet: A Two-dimensional Alien Map by Siteng Fan et al. Read it online here.
Prof Lewis Dartnell is an astrobiologist at the University of Westminster. This article originally appeared in the November 2019 issue of BBC Sky at Night Magazine.
